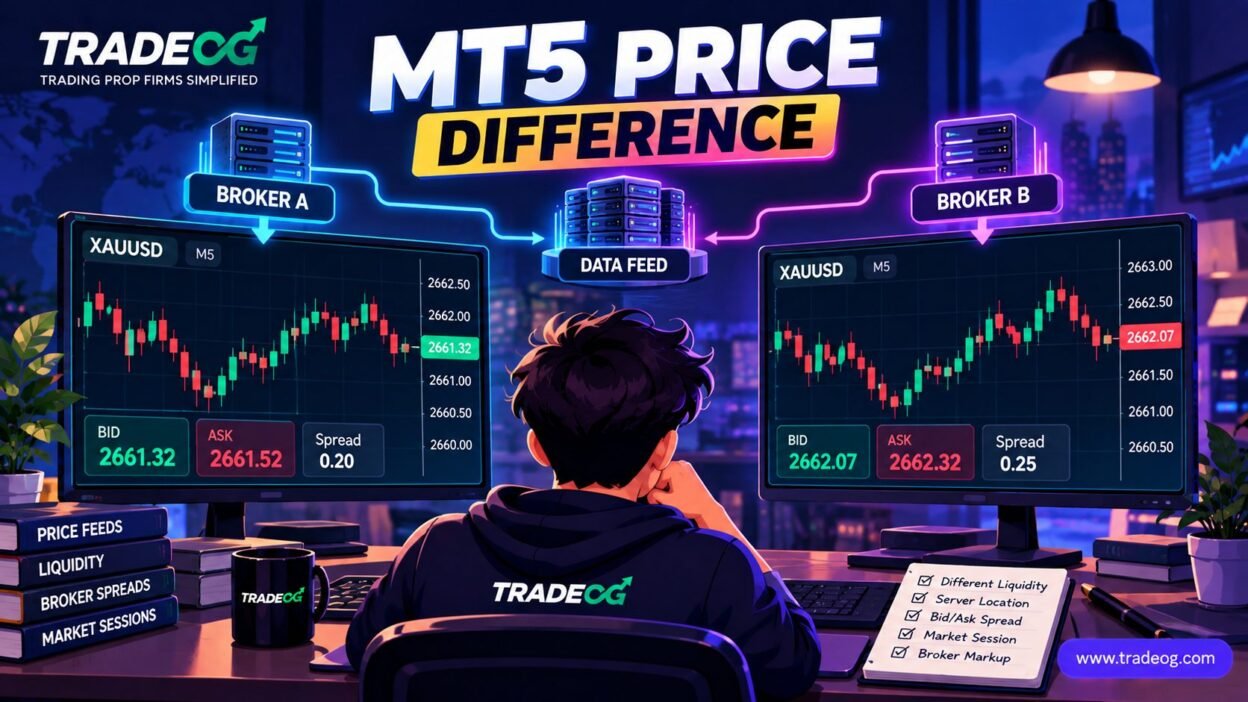
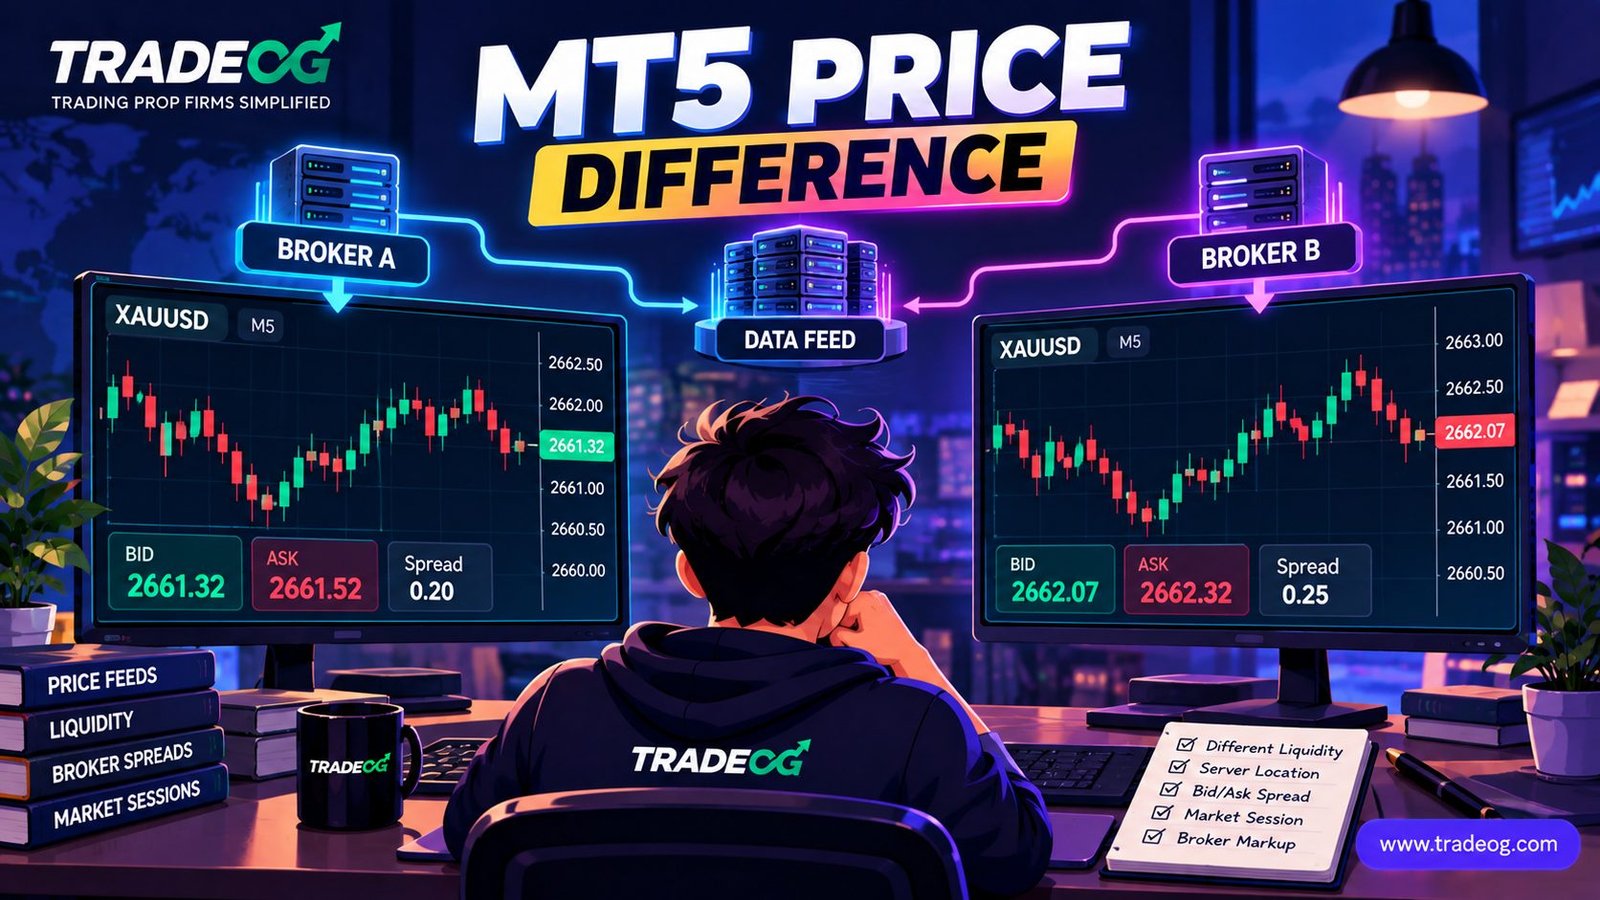
If you open XAU/USD on MetaTrader 5, TradingView, cTrader or another broker platform, you may notice something confusing: the same 15-minute candle does not always look exactly the same. The open, high, low, close, wick length or even the timing of a candle can differ slightly.
This does not automatically mean that one platform is showing an incorrect price. Spot gold is commonly traded through OTC broker networks rather than through one single central exchange price feed, and different platforms can receive, process and display quotes differently. MetaTrader 5 explains that OTC participants can aggregate prices from counterparties or provide their own quotes, while OTC charts are based on Bid prices. MetaTrader 5 Price Data
Why Can the Same XAU/USD Candle Look Different?
A candlestick is not a universal object that every platform downloads from one central database. It is constructed from price data received by the platform or broker during a specific time interval.
For a one-minute bar, MetaTrader 5 describes the candle as a collection of Open, High, Low and Close values created from symbol quotes or ticks. Higher timeframes are then constructed from lower-timeframe data. That means differences in the underlying tick stream can eventually appear as differences in the final candle. MetaTrader 5 documentation
For XAU/USD, the most common reasons include:
- Different liquidity providers
- Different broker price feeds
- Bid and Ask differences
- Different spreads
- Broker markups
- Different server or session times
- Different tick arrival and filtering
- Different historical-data construction
- Temporary price differences during volatile news
1. XAU/USD Does Not Have One Universal OTC Price
This is the most important concept.
When traders compare XAU/USD across retail brokers, they are often comparing different broker quote streams rather than looking at one centralized spot-gold order book. MetaTrader 5 notes that OTC market participants can aggregate prices from counterparties or set their own prices based on counterparties’ quotes.
As a result, Broker A might receive a slightly different stream from its liquidity providers than Broker B. Both can show prices that are valid within their respective trading environments while still producing small differences on the chart.
This is especially noticeable when gold moves quickly. A difference of a few cents or a fraction of a point can change which tick becomes the candle’s high or low.
2. Different Liquidity Providers Can Produce Different Ticks
Retail brokers can source liquidity through different providers and aggregation arrangements. The exact quote arriving at one broker does not necessarily have to be identical to the quote arriving at another.
Imagine two brokers receiving the following simplified tick sequence during one minute:
- Broker A: 2366.40 → 2367.10 → 2366.70
- Broker B: 2366.45 → 2367.06 → 2366.75
The difference is small, but the resulting OHLC values can still be different.
Over hundreds of ticks, these small differences can alter the exact shape of a candle. A wick may be slightly longer, the high may be a few points different, or the candle may close at a marginally different price.
3. Bid and Ask Prices Matter
Another major source of confusion is the difference between Bid and Ask.
MetaTrader 5 states that the Bid is the highest price at which a trader can sell, while the Ask is the lowest price at which a trader can buy. For OTC instruments, charts are based on Bid prices, while trading operations use Bid and Ask depending on the direction of the trade.
This matters because a trader may compare a chart candle with an execution price and conclude that the chart is wrong.
For example, a long position is opened using the Ask price, while the standard chart may be showing Bid. If the spread is 0.20, an apparent 0.20 difference does not necessarily represent a bad quote.
MetaTrader 5 also provides an Ask Price Line option because bars can be based on Bid or Last prices while the Ask price is used for certain trade operations. MetaTrader 5 chart settings
4. Different Spreads Change What You See
Suppose two brokers show approximately the same underlying gold market but use different spreads:
- Broker A: 0.15 spread
- Broker B: 0.30 spread
The underlying Bid stream may be close, but the Ask side can be noticeably different. During normal conditions this may be barely visible. During a major economic release, however, spreads can change rapidly.
This becomes important when comparing an entry, stop-loss or take-profit level across brokers. A level that is not touched on one feed may be reached on another because the quote and spread are slightly different.
5. Server Time Can Change Candle Boundaries
Sometimes the price feed itself is not the main reason. The candle’s time boundary can also matter.
A 15-minute candle is built from the data that falls inside its specific 15-minute interval. If two platforms use different server-time conventions or session boundaries, the same sequence of ticks can be grouped into different candles.
For example, one platform might construct a candle from 10:00 to 10:15 while another chart’s session configuration creates a different grouping. Even if the underlying prices are similar, the resulting candle structure can look different.
MetaTrader 5’s Market Watch documentation notes that quote arrival times are specified according to the broker’s trading-server time zone. MetaTrader 5 Market Watch
6. News Can Make Small Differences Look Huge
XAU/USD becomes particularly interesting around high-impact events such as CPI, NFP and FOMC decisions.
During fast markets, price can move through several levels in a very short period. Different feeds may receive ticks at slightly different moments, and spreads can change rapidly.
Imagine gold spikes upward for less than a second before reversing. If Broker A receives a tick at the peak and Broker B does not receive an equivalent quote, Broker A’s candle may display a longer upper wick.
That does not necessarily mean the broker manufactured the candle. It can simply reflect differences in the quote stream and tick history.
7. Historical Data Can Also Be Different
Another common situation occurs when you compare today’s chart with historical screenshots from another platform.
Historical data can be updated, rebuilt or supplied from different sources. A broker may have a more complete tick history for a particular period, while another platform may construct historical bars from a different data set.
This is why backtesting a strategy on one broker’s XAU/USD history and then applying the exact same parameters to another broker can produce different results.
Why This Matters for XAU/USD Traders
Small chart differences are normally not important for a long-term market view. They become much more important for traders using tight stops, scalping systems, automated strategies or precise breakout levels.
For example, suppose your strategy places a stop only 20 points away from entry. If two brokers have slightly different quotes during a fast move, one feed may touch the stop level while the other does not.
The difference can become even more relevant in a funded or prop firm account where daily loss limits and maximum drawdown rules can make a small execution difference financially meaningful.
Why a TradingView Candle May Not Match Your MT5 Candle
TradingView and MT5 are platforms, but the important question is not simply which platform you are using. You need to know which data source is behind the symbol you are viewing.
TradingView can display data supplied by different exchanges, brokers and data providers depending on the selected symbol. Your MT5 chart, meanwhile, is connected to your broker’s trading server and its quote stream.
Therefore, comparing an XAUUSD symbol on TradingView with an XAUUSD symbol on MT5 does not guarantee that you are comparing identical data.
Even when the charts look almost identical, the exact OHLC values can differ by a small amount.
Can Different Candles Trigger Different Trading Signals?
Yes.
Suppose your strategy requires a 15-minute candle to close above resistance. Platform A may close just above the level while Platform B closes slightly below it.
The result can be:
- Platform A generates a breakout signal.
- Platform B generates no signal.
- One broker triggers a pending order.
- Another broker leaves the order untouched.
This is one reason automated trading systems should be tested on the same symbol, broker environment and data source that will be used for live execution.
What About Stop-Loss Hunting?
A candle or price difference between two brokers is not, by itself, evidence that a broker is deliberately hunting stops.
A broker-specific quote can legitimately differ because of liquidity sources, spreads, server conditions and market structure. MetaTrader 5 itself documents that different brokers can have different price flows and notes that this can cause stop levels to be triggered at different times on different accounts. MetaTrader 5 Trading Signals documentation
If you suspect an abnormal quote, the useful approach is to document the exact timestamp, symbol, Bid, Ask, spread and broker server rather than judging the situation from a screenshot alone.
How to Compare Two XAU/USD Charts Properly
Step 1: Use the Same Timeframe
Compare M1 with M1, M5 with M5, or M15 with M15. Do not compare different timeframe constructions.
Step 2: Check the Exact Symbol
Make sure both platforms are displaying the intended XAU/USD instrument. Broker symbols can have different specifications and suffixes.
Step 3: Compare Bid With Bid
Do not compare one platform’s Bid with another platform’s Ask and call the difference a price error.
Step 4: Check Server Time
Confirm the time zone and session boundaries used to build the candles.
Step 5: Compare the Spread
Record both Bid and Ask at the same moment. The spread can explain part of an apparent execution difference.
Step 6: Compare Tick Data During the Event
If the difference occurred during CPI, NFP, FOMC or another fast market, compare the actual tick sequence rather than only the finished candle.
What Indian XAU/USD Traders Should Know
Indian traders often compare gold prices across several platforms before entering a trade. This can be useful, but the comparison should be made carefully.
If you trade through a prop firm or broker using MT5, the price that matters for your order is the price available on that trading environment. A TradingView chart can be useful for broader analysis, but it should not automatically be treated as the exact execution feed for your MT5 account.
This is particularly important for traders using very tight stops or trading XAU/USD around US economic releases.
Bottom Line
The same XAU/USD candle can look different on different platforms because the platforms may not be using the same underlying quote stream. Liquidity providers, broker feeds, Bid/Ask pricing, spreads, server time, tick history and candle construction can all contribute to small differences.
For most traders, a small difference between two charts is normal and does not invalidate the broader market analysis. But for scalpers, automated traders and prop firm traders using tight risk limits, those small differences can affect entries, stops and trade outcomes.
The best practice is simple: trade from the data feed that actually executes your orders, understand how that broker constructs its quotes, and test your strategy on the same environment you use in live trading.
Sources
- MetaTrader 5 — Price Data
- MetaTrader 5 — Market Watch
- MetaTrader 5 — Chart Settings
- MetaTrader 5 — Trading Signals
Frequently Asked Questions
Why does XAU/USD look different on MT5 and TradingView?
Because the two charts may use different data providers or broker feeds. The symbol name can look identical while the underlying quote stream is different.
Is it normal for two brokers to show different gold prices?
Small differences can be normal in OTC markets because brokers can receive and aggregate quotes differently and may apply different spreads or markups.
Which XAU/USD price should I use for trading?
For execution decisions, the price feed connected to your actual trading account is the relevant one. Use other platforms as reference data rather than assuming they have identical executable prices.
Can different XAU/USD candles affect stop-losses?
Yes. If price feeds differ enough around a level, one broker’s quote can reach a stop level while another broker’s quote does not.