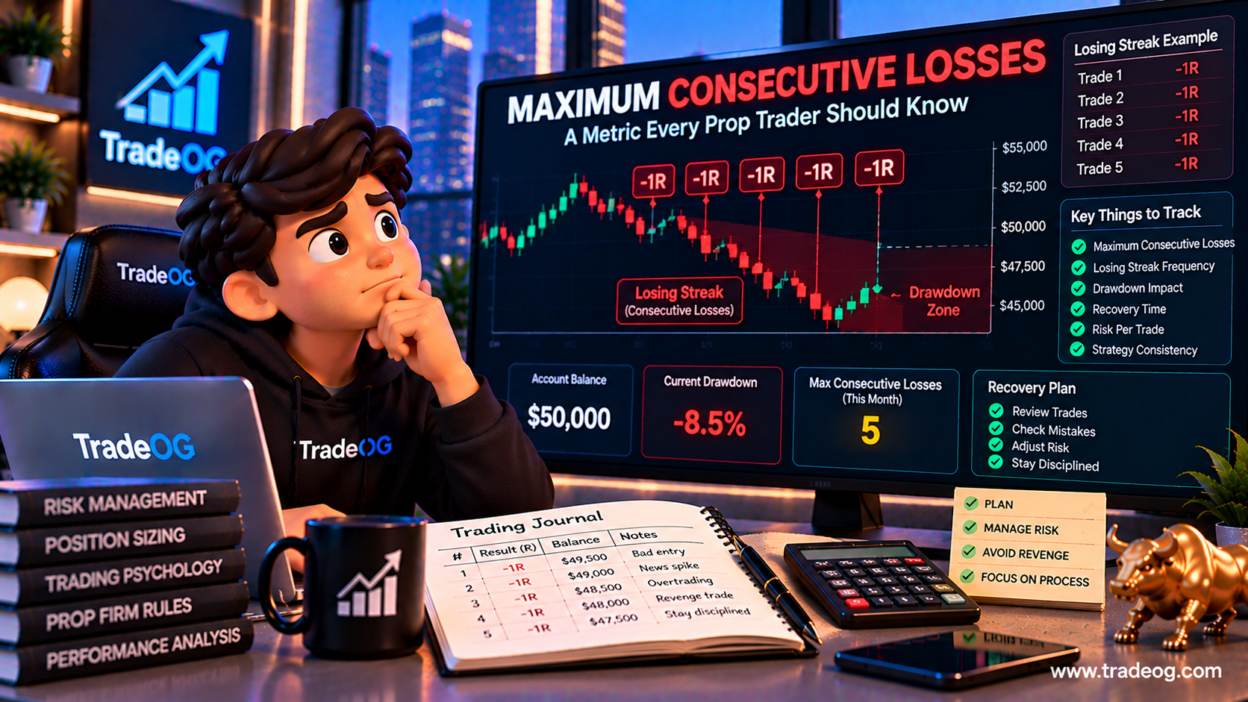

Most prop traders spend a lot of time looking at win rate, profit factor and total profit. One metric often gets less attention until an account is already under pressure: maximum consecutive losses.
Maximum consecutive losses tells you the longest losing streak in a defined set of trades. It sounds simple, but the number can reveal a great deal about how much drawdown your strategy can experience before the next winning trade arrives.
For a prop trader, that matters because an evaluation or funded account usually operates inside a finite loss buffer. A strategy can have positive expectancy and still produce a losing streak that creates significant drawdown. If your position size is too large for that normal losing sequence, the account can run into its loss limits before the statistical edge has time to play out.
This guide explains how to calculate maximum consecutive losses, how to interpret the number, how it relates to risk per trade and drawdown, why the historical maximum is not a guaranteed worst case, and how to use the metric when building a prop trading risk plan.
What Are Maximum Consecutive Losses?
Maximum consecutive losses is the largest number of losing trades that occurred back-to-back in a defined trading sample.
Consider this simplified sequence:
| Trade | Result |
|---|---|
| 1 | Win |
| 2 | Loss |
| 3 | Loss |
| 4 | Loss |
| 5 | Win |
| 6 | Loss |
| 7 | Loss |
| 8 | Win |
The maximum consecutive loss count is 3, because trades 2, 3 and 4 form the longest uninterrupted losing streak.
The metric does not tell you how much money was lost. Three small losses and three full-stop losses both count as three consecutive losses. That is why the metric should always be analyzed alongside actual loss size and drawdown.
Why This Metric Matters in Prop Trading
Prop trading introduces a specific constraint: you are not managing an unlimited amount of capital. The account has a defined risk boundary, and different programs can use different daily loss, maximum loss or drawdown mechanisms.
CME Group’s risk-management guidance emphasizes defining maximum trade loss and maximum day loss as part of a trading plan. It also notes that the amount risked per trade should be connected to account equity and the trader’s risk approach. CME Group — Risk Management and Your Trade Plan
That makes losing-streak analysis relevant. If your strategy historically produces five consecutive losses, your position size should not be chosen without considering what five losses would do to the available drawdown buffer.
For example, if a hypothetical trader risks 1% per trade and experiences five full planned losses, the simple arithmetic impact is 5% before considering changing equity, fees or slippage.
The same five-loss sequence at 0.5% planned risk would represent 2.5% under the same simplified assumptions.
How to Calculate Maximum Consecutive Losses
The calculation is straightforward.
- List all closed trades in chronological order.
- Classify each trade as win, loss or breakeven.
- Start counting when a losing trade appears.
- Continue counting until a win or your defined break condition appears.
- Record the length of each losing streak.
- Take the largest streak as the maximum consecutive losses.
For example:
W, L, L, W, L, L, L, L, W, L
The longest streak is four consecutive losses.
If your journal contains breakeven trades, decide how you will classify them before calculating the metric. A breakeven result may either interrupt a losing streak or be treated as neutral, depending on the reporting methodology you choose. The important part is to use the same rule across the entire dataset.
Maximum Consecutive Losses vs Maximum Drawdown
These metrics are related but they are not the same.
Maximum consecutive losses measures the length of the losing sequence.
Maximum drawdown measures the largest decline from an equity peak to a subsequent trough over the selected period.
Five consecutive losses might create a smaller drawdown than three consecutive losses if the first five trades were small and the three later trades were large.
For example:
| Scenario | Consecutive Losses | Loss Per Trade | Simple Total Loss |
|---|---|---|---|
| A | 5 | $100 | $500 |
| B | 3 | $300 | $900 |
Scenario A has the longer losing streak, but Scenario B creates the larger dollar drawdown.
This is why prop traders should track both metrics.
The Difference Between Losing Streak Length and Losing Streak Severity
Two strategies can have the same maximum consecutive losses while having completely different risk profiles.
Imagine Strategy A has five consecutive losses, each equal to -0.5R.
Strategy B also has five consecutive losses, but each is -1R.
Both have a maximum consecutive loss count of five.
But Strategy B consumes twice as much planned risk during the same streak.
A better journal therefore records:
- Maximum consecutive losses
- Largest losing streak in R
- Largest losing streak in dollars
- Worst same-day loss cluster
- Maximum account drawdown
How Risk Per Trade Changes the Impact
The simplest way to connect losing streaks with position sizing is:
Streak Loss ≈ Number of Consecutive Losses × Planned Risk Per Trade
Suppose a trader has a five-loss streak and uses a planned risk of $200 per trade.
5 × $200 = $1,000
If the same trader increases planned risk to $400:
5 × $400 = $2,000
The strategy did not change. The entry rules did not change. The losing streak did not change. Only the position risk changed.
This is why position sizing is one of the most important variables in prop trading.
CME Group similarly explains that traders should determine contract quantity based on risk scenarios rather than simply trading the maximum number of contracts allowed by margin. CME Group — Position and Risk Management
Why Your Historical Maximum Is Not a Guaranteed Maximum
This is one of the most important points in losing-streak analysis.
If your backtest or trading history shows a maximum of six consecutive losses, that does not mean your strategy can never produce seven, eight or more consecutive losses.
The historical maximum is simply the longest sequence observed in the sample you analyzed.
Future trades can occur in a different order. Market conditions can change. A strategy can experience a cluster of losses that did not appear in the historical period.
Recent research and discussion around prop-trading backtesting also emphasizes that a profitable backtest can still encounter losing clusters that interact badly with daily or maximum-loss rules. RealBacktesting — Losing Streaks in Prop Backtesting
Win Rate Does Not Eliminate Losing Streak Risk
A high win rate reduces the average frequency of losses, but it does not guarantee that losses will arrive evenly.
Consider a hypothetical strategy with a 60% win rate. Over a long sequence of trades, wins and losses can still cluster.
That is because a 60% historical win rate describes the proportion of wins in the sample. It does not dictate the exact order of future outcomes.
This is also why win rate should be combined with:
- Average win
- Average loss
- Expectancy
- Maximum consecutive losses
- Maximum drawdown
- Risk per trade
CME Group’s trading mathematics material similarly demonstrates that win frequency and average win/loss size must be considered together rather than treating accuracy as the only measure of a trading model. CME Group — The Mathematics of Trading Success
Expectancy and Maximum Consecutive Losses
A positive expectancy strategy can still experience a substantial losing streak.
Expectancy describes the average historical result per trade. It does not determine the order in which wins and losses will arrive.
For example, a hypothetical strategy could have:
- 45% win rate
- Average winner: +2R
- Average loser: -1R
Its simplified expectancy would be:
(0.45 × 2R) − (0.55 × 1R) = +0.35R
That is positive expectancy in the example, but the trader can still experience multiple losses before the next winner.
This is why the risk plan needs to survive the losing sequence, not merely produce a positive average.
How to Calculate a Losing-Streak Buffer
A practical way to analyze your account is to calculate how much drawdown a selected losing streak would consume.
Use:
Projected Streak Loss = Planned Risk Per Trade × Number of Consecutive Losses
Then compare the result with your available drawdown buffer.
Suppose:
- Available drawdown buffer = $2,500
- Planned risk = $250
- Stress streak = 8 losses
$250 × 8 = $2,000
The simplified eight-loss sequence would consume $2,000 of the $2,500 buffer, leaving only $500 before considering any other losses, slippage or account-specific rules.
This does not mean eight losses will occur. It means the trader can see how much room the chosen risk level leaves for a losing sequence.
Historical Streak vs Stress-Test Streak
Use two different numbers in your journal:
Historical maximum: the longest losing streak actually observed.
Stress-test streak: a deliberately larger losing sequence used to test whether the account and risk model remain viable.
For example:
| Metric | Example |
|---|---|
| Historical maximum | 5 losses |
| Recent maximum | 4 losses |
| Stress test | 8 losses |
| Planned risk | $200 |
| Stress-test loss | $1,600 |
The stress test is not a prediction. It is a way to understand the consequences if losses cluster more severely than they did in the observed sample.
Why Same-Day Losses Matter More for Prop Traders
Maximum consecutive losses normally counts trades in sequence, regardless of whether they occurred on the same day.
But prop accounts may have daily loss constraints, so a trader should separately track the largest cluster of losses inside one trading day.
For example:
- Monday: 2 losses
- Tuesday: 1 loss
- Wednesday: 5 losses
- Thursday: 2 losses
The overall maximum consecutive loss count might be seven if the sequence crosses trading days, but the Wednesday cluster of five may be more relevant to a daily loss limit.
Therefore, add a second metric:
Maximum Same-Day Loss Cluster
Track both separately.
Maximum Consecutive Losses in Futures Trading
For futures traders, losing-streak analysis should also account for contract size and point value.
CME Group notes that different futures contracts can have different volatility and tick values, which affects their dollar risk. It also emphasizes that contract quantity should be selected according to the risk scenario rather than simply using available margin. CME Group — Futures Position and Risk Management
For example, five consecutive losses on a Micro contract may have a very different dollar impact from five losses on a Mini contract, even when the chart setup looks similar.
That is why your journal should store the actual instrument and contract quantity for every trade.
Micro Futures and Losing-Streak Management
Micro futures can provide more granular position sizing because their contract specifications are smaller than the corresponding larger contracts.
That can make it easier to reduce exposure when your calculated risk falls between available position sizes.
But smaller contracts do not remove losing-streak risk.
If you trade more Micro contracts simply because each contract feels smaller, the total account exposure can still become significant.
The relevant calculation remains:
Total Planned Risk = Risk Per Contract × Number of Contracts
Always evaluate the complete position rather than the size of an individual contract.
What Maximum Consecutive Losses Can Reveal About Your Strategy
The metric is useful beyond position sizing.
1. It Can Reveal Strategy Variance
A strategy with frequent losing streaks may naturally require a different psychological and financial risk structure from one with losses that are more evenly distributed.
2. It Can Reveal Setup Problems
If nearly all losing streaks come from one setup, that setup deserves separate analysis.
3. It Can Reveal Market-Regime Sensitivity
If losing streaks cluster during specific volatility or market conditions, your journal can help identify the pattern.
4. It Can Reveal Oversizing
If a normal losing streak causes an unacceptable drawdown, the strategy may not be the only issue. Position size may be too large relative to the account buffer.
5. It Can Reveal Discipline Problems
If the final trades in losing streaks are frequently rule violations, the account may be suffering from behavior rather than purely from strategy variance.
Track Maximum Consecutive Losses by Setup
One overall number can hide important differences.
Suppose your journal contains three setups:
| Setup | Trades | Win Rate | Max Consecutive Losses |
|---|---|---|---|
| Breakout | 120 | 52% | 5 |
| Pullback | 95 | 61% | 3 |
| Reversal | 80 | 44% | 8 |
These figures are hypothetical. The point is that the overall account maximum might hide the fact that one setup has a much longer losing sequence.
Track the metric by setup when the sample size is meaningful enough to support comparison.
Track Losing Streaks by Market Session
You can also break the metric down by trading session or time window.
For example:
- London session
- New York open
- New York afternoon
- Specific scheduled news windows
- Overnight trading
If losses cluster in one period, investigate whether volatility, liquidity, execution or strategy selection is different during that window.
Do not automatically remove a session based on a short losing streak. Use a sufficiently large sample and examine the broader performance statistics.
What to Do After a Losing Streak
A losing streak should trigger a process review, not an automatic conclusion that the strategy has failed.
Review:
- Were all trades valid according to the strategy?
- Did planned risk remain consistent?
- Did actual losses exceed planned losses?
- Were stops moved?
- Was position size increased?
- Did market conditions change?
- Did several trades have the same underlying market exposure?
- Did the losses occur in one setup or across the entire system?
If the trades followed the plan and the losses are within the strategy’s historical behavior, the streak may simply be part of the distribution of outcomes.
If the streak contains repeated rule violations, the appropriate review is different because the trading process itself changed.
Should You Reduce Risk After a Losing Streak?
There is no universal answer.
What matters is whether the rule is part of your tested trading plan.
If your strategy has been tested with a fixed risk level, suddenly cutting risk after every losing streak changes the system. That can be tested as a separate risk-management rule, but it should not be confused with the original strategy’s historical results.
The important principle is to avoid making discretionary risk changes simply because a trader feels uncomfortable after several losses.
Why Revenge Trading Can Make the Streak Worse
One of the biggest dangers after consecutive losses is changing the risk model emotionally.
A trader may increase position size because they want to recover the previous losses quickly. That creates a compounding problem:
Loss → larger position → larger loss → even larger recovery pressure
A predefined maximum risk per trade can help prevent this feedback loop.
CME Group’s risk-management material emphasizes establishing loss parameters before trading and sticking to the defined approach. CME Group — The 2% Rule
Recovery Math After a Losing Streak
Another reason to monitor consecutive losses is that recovering a drawdown requires a larger percentage gain than the percentage originally lost.
For example, after a 10% decline, an account needs an 11.11% gain from the reduced balance to return to the original level. After a 20% decline, the required recovery is 25%.
CME Group illustrates this asymmetric recovery relationship in its risk-management education. CME Group — Controlling Risk
This is another reason why limiting drawdown during losing streaks can matter more than trying to maximize the return of every winning trade.
A Practical Maximum-Loss-Streak Dashboard
A prop trader can keep a simple dashboard with these fields:
| Metric | What to Track |
|---|---|
| Current losing streak | Losses in the current sequence |
| Historical maximum | Longest observed streak |
| Stress-test streak | Chosen scenario for risk testing |
| Loss per trade | Planned dollar risk |
| Streak loss | Dollar impact of selected streak |
| Maximum drawdown | Largest equity decline |
| Daily loss cluster | Largest same-day loss |
| Recovery amount | Gain required to return to previous peak |
| Rule violations | Number during losing streaks |
This makes losing-streak risk visible before it becomes an account problem.
How to Build a Losing-Streak Risk Test
Use this simple five-step process:
- Find your historical maximum. Calculate the longest consecutive losing sequence.
- Find your worst dollar streak. Identify the sequence that produced the largest cumulative loss.
- Measure your planned risk. Determine the normal dollar or R risk per trade.
- Run a larger stress case. Test a streak longer than the historical maximum.
- Compare it with your drawdown buffer. Check what percentage of available loss capacity would be consumed.
The goal is not to predict the next losing streak. The goal is to understand whether your position size leaves enough room for unfavorable sequences.
Common Mistakes With Maximum Consecutive Losses
- Treating the historical maximum as a guarantee: Future sequences can be longer.
- Looking only at streak length: Loss size determines the actual financial impact.
- Ignoring same-day clustering: Daily loss rules can make clustering especially important.
- Ignoring position size: The same streak can have radically different consequences at different risk levels.
- Combining all setups: One problematic setup can hide inside a healthy aggregate number.
- Ignoring market regime: A strategy can behave differently across volatility environments.
- Increasing risk after losses: Recovery attempts can magnify the drawdown.
- Using a tiny sample: A short history can produce an unstable estimate of the longest streak.
- Ignoring execution: Slippage can make actual losses larger than planned losses.
Frequently Asked Questions
What is a normal maximum consecutive loss?
There is no universal normal value. It depends on win rate, payoff distribution, trade frequency, sample size and the order of historical outcomes.
How many consecutive losses should a prop trader be able to survive?
There is no universal number. A useful risk plan should examine the strategy’s historical streaks and a larger stress-test scenario against the account’s actual drawdown buffer.
Does a losing streak mean my strategy is broken?
No. A losing streak can occur within a profitable strategy. Review whether the trades followed the system and whether the streak falls within a plausible range of historical outcomes.
Should maximum consecutive losses be measured in trades or money?
Both. The trade count measures streak length, while dollar and R-based measurements show the financial severity of the streak.
Can a high win-rate strategy have a long losing streak?
Yes. Win rate describes the proportion of winning trades in a sample; it does not specify the exact sequence in which future trades will occur.
Should I use Monte Carlo analysis?
Monte Carlo or trade-sequence resampling can be useful for stress testing, but it should be treated as an analytical scenario rather than a prediction of future performance. The quality of the underlying trade sample also matters.
Final Takeaway
Maximum consecutive losses is one of the most useful risk metrics for a prop trader because it connects strategy performance with account survival.
Do not look at the metric alone. Combine it with risk per trade, maximum drawdown, largest losing streak in dollars and R, same-day loss clusters, expectancy, win rate and the account’s actual drawdown rules.
The historical maximum tells you what happened in your sample. A stress test tells you what would happen if the next losing sequence were worse. Neither one predicts the future, but both can help you understand whether your position sizing is robust enough for the risk you are taking.
The practical framework is simple: measure the streak, measure its financial impact, compare it with your drawdown buffer, and keep position risk small enough that normal losing sequences do not immediately threaten the account.
That is the real value of this metric. It is not about fearing losses. It is about knowing how many losses your trading plan can absorb before the risk model itself becomes the problem.