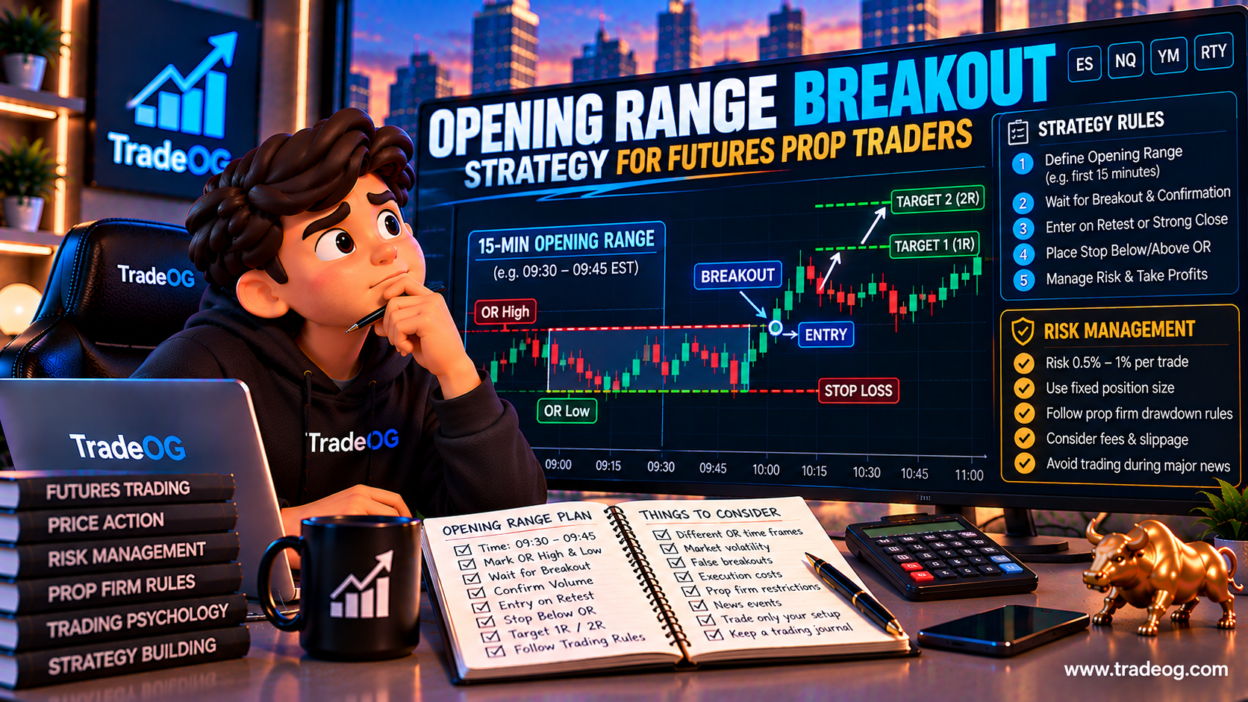

The Opening Range Breakout (ORB) is one of the simplest ways to structure an intraday futures trading setup: define a range during the opening portion of a session, wait for price to break that range, and manage the trade using predefined risk rules.
For futures prop traders, however, the basic chart pattern is only the starting point. A breakout can fail, slippage can change the fill, the opening range can become unusually wide, and a position that looks acceptable on a normal brokerage account can be too large for a prop firm’s drawdown structure.
This guide explains how an opening range breakout strategy works, how traders can define the range, how breakout confirmation can be structured, where stops and targets can be placed, how ES and NQ traders commonly adapt the setup, and what prop traders should check before turning ORB into a repeatable trading plan.
Important: The examples below are educational and hypothetical. An ORB setup does not guarantee profitable results, and the exact trading rules of a prop firm can differ.
What Is an Opening Range Breakout?
An Opening Range Breakout defines a high and low during a specified opening period. After that range is established, the trader watches for price to move outside one of those boundaries.
The opening range can be five, fifteen, thirty minutes or another consistently defined period. There is no universal ORB duration that applies to every market or trader. FTMO’s educational material, for example, discusses 5-, 15- and 30-minute opening ranges and describes a full candle close beyond the range as one possible confirmation method.
For US index futures such as ES and NQ, many intraday traders focus on the US regular-session open. The exact session definition should be stated in the trading plan rather than assumed.
Why ORB Is Popular With Futures Traders
The attraction of ORB is its structure.
- The range is defined before the breakout.
- The breakout level is visible on the chart.
- Invalidation can be defined around the opposite side of the range.
- Position size can be calculated from the stop distance.
- The same framework can be tested across many sessions.
- The setup can be adapted to different futures contracts.
That structure can be particularly useful for a prop trader because the trader can define the risk before entering rather than deciding the position size after price starts moving.
CME’s position and risk management material emphasizes selecting the contract, controlling the number of contracts and using stops within the trader’s risk tolerance.
How the Opening Range Is Defined
The first decision is the length of the opening range.
| Opening Range | General Character | Potential Trade-Off |
|---|---|---|
| 5 minutes | Fast and sensitive | More signals and potentially more noise |
| 15 minutes | Balanced intraday framework | Moderate waiting time and range size |
| 30 minutes | More developed range | Fewer opportunities and potentially wider stops |
These are structural descriptions, not guarantees of performance. The correct choice should come from testing the same rules over a sufficiently large sample.
The Basic 15-Minute ORB Setup
A simple example uses the first 15 minutes of the chosen regular trading session.
The process is:
- Start the session timer.
- Record the highest price during the first 15 minutes.
- Record the lowest price during the first 15 minutes.
- Lock those two levels after the opening range ends.
- Wait for price to break above or below the range.
- Require your predefined confirmation condition.
- Calculate position size from the stop distance.
- Enter only if the planned trade fits the account’s risk limits.
The setup becomes a strategy only when the trader defines the details consistently.
Long ORB Setup
A basic long ORB setup can be structured as follows:
- Define the opening range high and low.
- Wait for price to move above the opening range high.
- Use a predefined breakout confirmation rule.
- Calculate the stop location before entry.
- Calculate the number of contracts based on maximum dollar risk.
- Enter only if the resulting trade meets the plan.
A trader might require a candle close above the range rather than entering on the first wick through the high. That can reduce some immediate breakout attempts, but it can also produce a later entry and a larger stop distance.
Short ORB Setup
The short version is the mirror image:
- Define the opening range.
- Wait for price to break below the opening range low.
- Apply the chosen confirmation condition.
- Define the stop before entering.
- Calculate position size from dollar risk.
- Manage the trade according to the predefined plan.
The important principle is symmetry. If the rules are discretionary in one direction but mechanical in the other, the historical test may not represent how the strategy will actually be traded.
Breakout Confirmation: Close vs Wick
One of the biggest ORB decisions is what counts as a breakout.
A wick through the range is not necessarily acceptance outside the range. Price can temporarily move above the high, attract breakout buyers, and then return inside the range.
One confirmation model is to require a candle to close outside the range. FTMO’s ORB educational guide describes this approach as one way of confirming a breakout.
Another model is to wait for a breakout followed by a retest.
There is no universal rule that guarantees the best result. The important point is to define the rule before collecting performance data.
ORB Retest Entry
A retest model waits for price to break the opening range and then return toward the broken boundary.
For a bullish breakout:
- Price breaks above the OR high.
- The breakout continues or pauses above the level.
- Price pulls back toward the OR high.
- The trader waits for the chosen confirmation.
- The long entry occurs only if the retest meets the plan.
The potential advantage is a more structured entry. The trade-off is that the market may never retest the level, leaving the trader without an entry.
Where Should the Stop Loss Go?
There is no single correct stop location for every ORB system.
Common frameworks include:
- Below the opening range high after a bullish breakout and retest
- Below the retest swing low
- Below the opening range low for a wider invalidation model
- A volatility-based stop
- A fixed point or tick stop tested for the specific contract
The stop should be selected before the position size. CME’s risk-management guidance notes that traders should choose contract size and number of contracts according to risk scenarios rather than simply using the maximum permitted by margin.
How to Calculate ORB Position Size
The position-sizing equation is straightforward:
Contracts = Maximum Dollar Risk ÷ Dollar Risk Per Contract
For futures:
Dollar Risk Per Contract = Stop Distance × Dollar Value Per Point
Suppose a hypothetical setup has:
- Maximum planned risk = $200
- Stop distance = 10 points
- Contract value = $5 per point
Risk per contract would be:
10 × $5 = $50
The theoretical maximum number of contracts based only on that risk limit would be:
$200 ÷ $50 = 4 contracts
This is a mathematical example, not a recommendation to trade four contracts. A prop firm’s maximum position size, daily loss limit, remaining drawdown and execution conditions may require a smaller position.
Why the Opening Range Width Matters
The opening range itself contains useful information about the day’s early volatility.
A very narrow range can produce a relatively small breakout stop but may also be vulnerable to repeated false breaks.
A very wide range can reduce the number of practical entries because the stop becomes large relative to the account’s risk limit.
For that reason, ORB traders often record:
- Opening range width
- Opening range width as a percentage of price
- Opening range width relative to recent sessions
- Time of breakout
- Breakout direction
- Maximum favorable excursion
- Maximum adverse excursion
Instead of assuming that every ORB is equally tradable, you can test how results change across different range sizes.
ORB and False Breakouts
False breakouts are one of the central risks of the strategy.
A typical failure looks like this:
- Price breaks above the OR high.
- Buyers enter.
- Price fails to continue.
- Price returns inside the range.
- The trade reaches the stop.
The opposite can happen on downside breaks.
Rather than assuming every breakout should be traded, a trader can define filters for when a breakout is considered valid.
Potential ORB Filters
Common research variables include:
- Breakout candle close
- Volume
- VWAP location
- Previous session high or low
- Overnight high or low
- Opening range width
- Distance from major reference levels
- Time of breakout
- Market volatility
- Scheduled economic events
These should be treated as testable variables rather than assumed performance enhancers.
ORB With VWAP
Some traders combine ORB with VWAP as a directional filter.
A hypothetical framework might require:
- Price above VWAP for a long ORB
- Price below VWAP for a short ORB
This reduces the number of trades, so the filter should be evaluated against the original ORB rules rather than added simply because it looks logical on a chart.
ORB With Previous Day Levels
Previous day high, previous day low and settlement-related reference levels can provide additional context.
For example, a trader can record whether the OR breakout occurs:
- Above the previous day’s high
- Below the previous day’s low
- Inside the previous day’s range
- Near a major prior-session level
This allows the trader to segment the historical results instead of treating every breakout as identical.
ORB on ES and NQ
ES and NQ are commonly discussed in futures ORB systems, but the same concept can be applied to other permitted futures markets.
The key difference is that each contract has its own point value, tick value, volatility profile and liquidity characteristics.
That means a 10-point move does not represent the same dollar result across every futures contract.
Before trading an ORB system, calculate the dollar risk using the exact contract and number of contracts you intend to trade.
Micro Futures and ORB
Micro contracts can provide smaller dollar exposure than their corresponding E-mini contracts, which can make position sizing more granular.
For example, a trader testing an ORB strategy can use a Micro contract to express a smaller dollar risk when the opening range is wide.
However, “Micro” does not mean “no risk.” A repeated sequence of losing ORB trades can still consume a meaningful portion of a prop firm’s drawdown.
The relevant question is always the dollar risk created by the actual position and stop.
ORB and Prop Firm Drawdown
This is where a normal ORB strategy becomes a prop-specific strategy.
Suppose your trading account has a defined maximum loss threshold. An ORB system might produce several losses in a row before a trend day produces a larger winner.
If each trade is too large relative to the available drawdown buffer, the strategy can fail even if its long-term backtest is profitable.
Track:
- Risk per ORB trade
- Maximum consecutive ORB losses
- Worst daily ORB result
- Maximum drawdown
- Average R per trade
- Largest losing trade
- Slippage during breakout entries
This creates a more realistic picture of how the strategy interacts with a prop account.
ORB and Daily Loss Limits
A trader can also establish a daily stop rule.
For example, a hypothetical system could stop taking new ORB attempts after a predefined daily loss amount. The exact threshold should be determined by the trader’s risk plan and the firm’s current rules.
This can prevent a common problem: repeatedly trading every subsequent breakout after the first setup fails.
The strategy should specify whether one failed ORB ends the trading day or whether a second attempt is permitted.
Should You Take Both Directions?
Some ORB systems permit a long breakout and a short breakout on the same day.
Others use a one-and-done model.
Both approaches can be tested.
A two-sided system should explicitly define what happens after the first breakout fails. For example, does a stopped long trade allow a later short breakout? Is there a cooldown period? Is there a maximum number of ORB attempts per session?
These details can have a significant effect on the strategy’s trade count and drawdown profile.
ORB and Major Economic News
The US market open can overlap with important economic releases on some days. A breakout around a scheduled release can behave differently from a normal opening move because volatility and execution conditions can change rapidly.
Prop-firm rules also differ. Topstep’s current rules, for example, include restrictions around intentionally trading maximum position size directly into major scheduled news events.
FTMO Futures states that traders can use different trading styles as long as the activity is legitimate, consistent with real-market conditions and its forbidden-practice rules.
Therefore, never assume that an ORB news filter is allowed or required across every firm. Check the current rules of the specific program.
ORB and Slippage
Breakout strategies can be particularly sensitive to execution because the entry occurs when price is moving through a predefined level.
If the market moves rapidly, the actual fill can differ from the intended entry.
That matters because your planned R:R may change after execution.
For every ORB backtest or live review, record:
- Planned entry
- Actual fill
- Planned stop
- Actual exit
- Slippage
- Fees
- Net result
A strategy that looks profitable before execution costs may produce a very different result after realistic costs are included.
ORB Entry Models
| Entry Model | Basic Idea | Trade-Off |
|---|---|---|
| Immediate Break | Enter as price breaks the OR boundary | Fast entry but vulnerable to false breaks and slippage |
| Candle Close | Wait for confirmation close outside range | More confirmation but potentially worse price |
| Retest | Wait for price to revisit the broken level | More structured entry but may miss the move |
| Confirmation + Retest | Require both breakout and retest behavior | Fewer trades and potentially later entries |
There is no universal winner. The correct model is the one you can define precisely and evaluate using consistent historical data.
ORB Profit Targets
Targets can be structured in several ways.
Fixed R Target
For example, a system might test 1R, 1.5R or 2R targets.
If the initial risk is $100, a 2R target represents a $200 planned profit before costs.
Opening Range Projection
Another method projects the opening range width beyond the breakout point.
If the opening range is 20 points wide, a trader might test a target based on one or more range-width projections.
Trailing Exit
A trader can also test a trailing stop or structure-based exit rather than a fixed target.
Each method changes the distribution of R results, so the exit rule should be part of the backtest rather than changed after reviewing results.
One Trade Example
Consider a hypothetical 15-minute ORB on a futures contract.
- Opening range high = 5,020
- Opening range low = 5,000
- Breakout = above 5,020
- Entry = 5,022
- Stop = 5,012
- Stop distance = 10 points
If the contract’s value is $5 per point, planned risk is:
10 × $5 = $50 per contract
If the trade later exits at 5,042, the gross move from entry is 20 points, or $100 per contract before costs.
That is a hypothetical +2R result if $50 was the original planned risk.
The example demonstrates the calculation; it does not imply that a 2R target is appropriate for every ORB system.
ORB Failure Example
Now consider the same range.
- OR high = 5,020
- Entry = 5,022
- Stop = 5,012
- Price falls to the stop
The result is approximately:
-10 points × $5 = -$50 per contract
That is -1R before costs if $50 was the planned risk.
The value of the R framework is that this result can be compared with trades taken at different prices, contract sizes and stop distances.
ORB Backtesting Framework
Before trading the setup with real prop-account risk, define every rule.
Your backtest should specify:
- Market and contract
- Session definition
- Opening-range duration
- Long breakout condition
- Short breakout condition
- Confirmation requirement
- Entry method
- Stop placement
- Target or exit rule
- Maximum trades per day
- News filter
- Slippage assumption
- Commission and fee assumptions
- Position-sizing rule
- Daily loss rule
If these rules are not fixed, it becomes easy to change the strategy after seeing the historical results.
What Metrics Should You Track?
Do not evaluate ORB using win rate alone.
| Metric | Why Track It? |
|---|---|
| Win Rate | Shows how frequently trades are profitable |
| Average R | Shows average result relative to planned risk |
| Profit Factor | Compares gross profits with gross losses |
| Maximum Drawdown | Shows peak-to-trough equity decline |
| Max Consecutive Losses | Shows losing-streak pressure |
| Average Range Width | Shows how the opening range changes |
| Slippage | Shows execution impact |
| Time of Breakout | Shows whether timing affects outcomes |
| MAE/MFE | Shows adverse and favorable excursion |
ORB by Market Regime
A strategy can behave differently in trending and rotational markets.
Consider separating your results into categories such as:
- Strong trend days
- Range-bound sessions
- High-volatility sessions
- Low-volatility sessions
- Major news days
- Normal calendar days
This does not mean you should automatically exclude every difficult market condition. It means you can understand where the strategy’s historical results came from.
ORB Trading Plan for a Prop Trader
A simple written plan could look like this:
- Trade only the selected futures market.
- Define the opening range using a fixed session and duration.
- Do not trade inside the range after it is established unless a separate setup exists.
- Wait for the predefined breakout confirmation.
- Calculate the stop before entry.
- Calculate contracts from maximum dollar risk.
- Check remaining drawdown before entering.
- Check the prop firm’s current instrument and news rules.
- Record the actual fill.
- Exit according to the predefined target or management rule.
- Record the result in R.
- Stop trading when the daily plan says to stop.
Common ORB Mistakes
1. Entering Every Wick
A temporary move through the OR high or low does not automatically mean the breakout is confirmed.
2. Making the Range Different Every Day
If the opening range changes from 5 minutes one day to 30 minutes the next, your results become difficult to interpret.
3. Ignoring Range Width
A very wide range can produce a stop that is too large for the planned risk.
4. Using Maximum Contracts
The maximum contracts allowed by a platform are not necessarily the correct position size for your risk plan. CME explicitly distinguishes contract count and risk management from simply trading the maximum allowed by margin.
5. Ignoring Slippage
Breakout entries can experience execution differences, particularly when price moves quickly.
6. Overfitting Filters
Adding many filters can make historical results look attractive while making the strategy fragile outside the tested sample.
7. Revenge Trading After a Failed Breakout
A failed ORB does not automatically mean the next breakout will work. Define the maximum number of attempts before the session begins.
Is ORB Suitable for Every Prop Firm?
There is no universal answer because prop firms use different products, trading hours, position rules and prohibited-practice policies.
Topstep currently describes its program as futures-only, with positions required to be closed by 3:10 PM CT on weekdays and trading resuming at 5:00 PM CT.
FTMO Futures states that traders can use discretionary, algorithmic or other legitimate trading styles subject to its current rules and forbidden-practice requirements.
The lesson for an ORB trader is simple: the strategy rules and the prop firm’s account rules are two separate documents. Both need to be checked before trading.
ORB Checklist Before the Session
- ☐ Correct futures contract selected
- ☐ Correct session time confirmed
- ☐ Opening-range duration fixed
- ☐ Previous day levels marked
- ☐ Scheduled economic events checked
- ☐ Maximum daily risk known
- ☐ Remaining drawdown known
- ☐ Maximum contracts calculated
- ☐ Entry confirmation defined
- ☐ Stop location defined
- ☐ Target or exit rule defined
- ☐ Slippage and fees considered
- ☐ Maximum number of attempts defined
Frequently Asked Questions
What is the best opening range for futures?
There is no universal best duration. Five-, fifteen- and thirty-minute ranges are common research choices. Test the same rules over a meaningful sample rather than assuming one duration is automatically superior.
Is a 15-minute ORB good for prop trading?
A 15-minute ORB can be tested as a structured intraday setup, but suitability depends on the market, execution, risk parameters and the specific prop firm’s rules. Historical performance does not guarantee future results.
Which futures can be traded with ORB?
The framework can be applied to permitted futures markets, including equity-index futures and other liquid contracts. The exact instrument list depends on the trading program.
Should I use ES or NQ for ORB?
ES and NQ have different contract specifications, volatility characteristics and dollar exposure. Rather than choosing based on the chart alone, compare your historical results, execution costs and risk per contract.
Should I trade every breakout?
Not necessarily. A trading plan can require confirmation, a retest, a time window, a volatility condition or another predefined filter. Any filter should be tested rather than assumed to improve performance.
Can ORB work with Micro futures?
Yes, if the Micro contract is permitted by the trading program. Micro contracts can provide smaller dollar exposure, but repeated losses can still consume drawdown.
What is the biggest ORB risk?
False breakouts and execution risk are two important considerations. A breakout strategy can also become vulnerable when the opening range is unusually wide or when market volatility changes rapidly.
Can ORB be automated?
The rules can be expressed algorithmically if the session, range, breakout, entry, stop, target and risk rules are precise. However, automation must comply with the specific prop firm’s current technology and strategy rules.
Final Takeaway
The Opening Range Breakout is simple to describe but difficult to trade well without precise rules.
The basic concept is:
Define the opening range → wait for a confirmed break → size the position from the stop → manage the trade according to predefined rules.
For futures prop traders, the most important addition is risk control. Contract size, stop distance, remaining drawdown, daily loss limits, execution costs and the firm’s current restrictions all matter.
Do not judge an ORB system only by its win rate. Track average R, profit factor, maximum drawdown, consecutive losses, range width, breakout timing, slippage and costs. Then test the strategy across different market conditions.
A good ORB research process is not about finding a perfect breakout rule. It is about creating a clearly defined setup that can be measured honestly and traded within the actual constraints of the account.
Sources: FTMO — Opening Range Breakout Strategy; CME Group — Position and Risk Management; Topstep — When and What Products Can I Trade?; Topstep — Prohibited Trading Strategies; FTMO Futures — Instruments and Trading Strategies.