

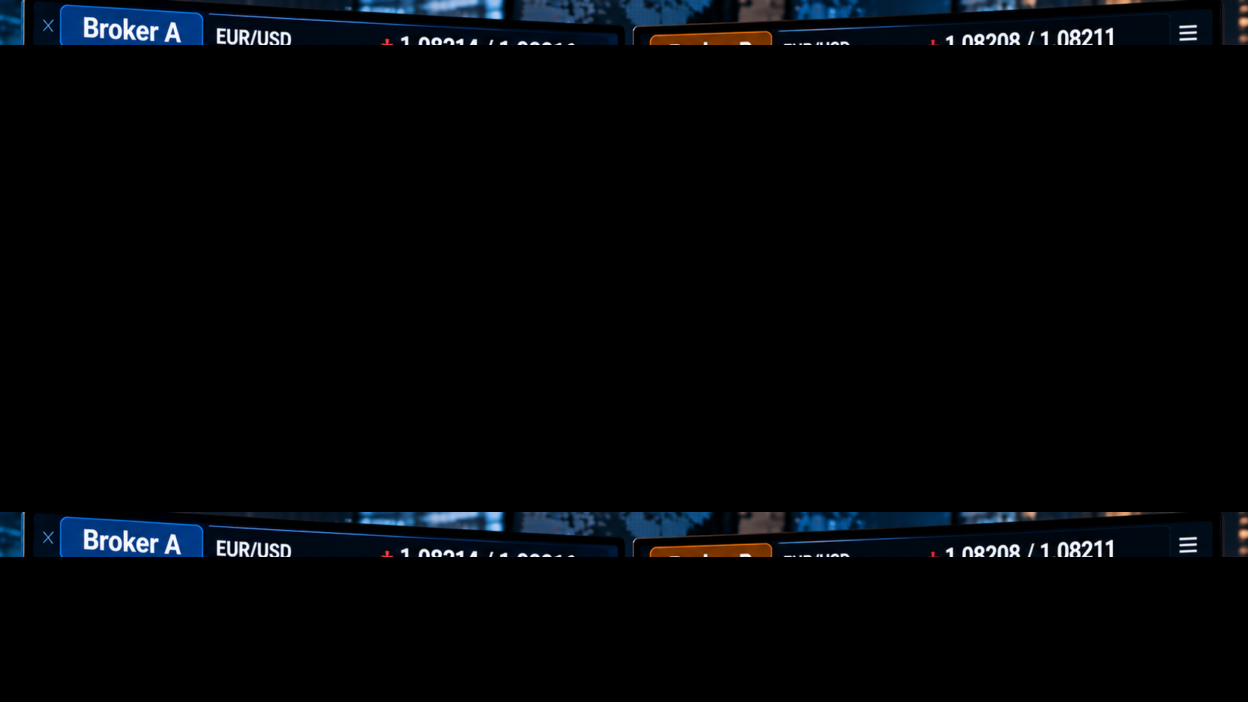
Have you ever opened the same EUR/USD or GBP/USD chart on two different forex brokers and noticed that the daily high, daily low, or even the current price is slightly different? One broker may show a high of 1.08326 while another records 1.08318. One chart may appear to touch a level that the other never reached.
This does not automatically mean that one broker is manipulating the market. The foreign exchange market is an over-the-counter (OTC), fragmented market, so retail brokers can receive, construct and display prices from different liquidity sources and trading relationships.
That difference matters because many traders use previous highs, previous lows, support, resistance, stop-losses, breakout levels and technical indicators based on their broker’s price feed. Understanding why those prices differ can prevent a lot of confusion.
Quick Answer: Why Can Two Forex Brokers Show Different Highs and Lows?
Two brokers can show different forex highs and lows because they may use different liquidity providers, price feeds, liquidity pools, aggregation methods, bid/ask prices, server timing and quote-update frequencies.
There is no single central spot-FX exchange that publishes one universal high and low for every retail broker. The underlying FX market contains multiple venues, dealers and liquidity providers, and brokers can construct their client-facing quotes from different sources.
Small differences are therefore normal, especially around news releases, market opens, rollovers and periods of thin liquidity. Larger or persistent differences deserve closer investigation.
1. Forex Is Not One Centralised Price Feed
This is the most important concept to understand.
When you look at a stock traded on a central exchange, there is a defined marketplace where bids, offers and executed trades are consolidated. Spot forex works differently. It is a global OTC market involving banks, non-bank liquidity providers, dealers, electronic venues and other participants.
The Bank for International Settlements describes spot FX as a fragmented market with multiple venues and liquidity providers. That structure means different participants can see or receive different executable prices at the same moment.
Retail brokers sit within this wider network. They do not necessarily receive an identical stream of prices.
2. Different Brokers Can Use Different Liquidity Providers
A broker may source prices from several banks, non-bank liquidity providers, prime brokers, electronic communication networks or other liquidity venues.
Another broker may use a different combination.
Imagine two brokers receiving these EUR/USD quotes at almost the same instant:
| Source | Bid | Ask |
|---|---|---|
| Liquidity Provider A | 1.08214 | 1.08216 |
| Liquidity Provider B | 1.08212 | 1.08215 |
| Liquidity Provider C | 1.08210 | 1.08214 |
Broker A might receive stronger pricing from Providers A and B, while Broker B might have a different liquidity mix. Their charts can consequently record slightly different price extremes.
This is closely related to how liquidity providers affect forex prices.
3. Price Aggregation Can Produce Different Quotes
Many brokers use technology that combines quotes from multiple sources. This is often called liquidity aggregation.
The aggregation engine may compare available bids and asks, apply routing rules, manage different liquidity tiers and construct the price stream delivered to clients.
Two brokers can therefore use different aggregation logic even if some of their underlying liquidity providers overlap.
This does not mean that either broker has invented a completely separate market. It means each broker is showing a particular view of a fragmented market.
4. Bid and Ask Prices Can Change the High and Low You See
This is one of the biggest reasons traders become confused.
A forex quote has two sides:
- Bid: the price at which the market is willing to buy from you.
- Ask: the price at which the market is willing to sell to you.
The difference between them is the spread.
Depending on the platform and chart settings, the visible candlesticks may primarily represent the bid stream, while the ask price can be displayed separately or used for execution conditions.
This creates an important practical issue: a trader may see a candle high on the chart and assume that the market’s executable ask never reached a particular level. In reality, the opposite side of the spread may have reached it.
For retail FX trading, understanding bid versus ask is essential when analysing stop-losses, take-profits and breakout levels.
5. A Wider Spread Can Change the Recorded High or Low
Suppose two brokers receive a similar underlying market price but quote different spreads.
Broker A might show:
Bid 1.08214 / Ask 1.08216
Broker B might show:
Bid 1.08212 / Ask 1.08217
The difference looks tiny, but over many candles it can change the highest and lowest values recorded by each chart.
This becomes especially visible during volatile periods when spreads can widen quickly.
6. Different Quote Update Speeds Can Matter
Forex prices can update many times per second. A broker’s technology must receive, process and distribute those updates to its trading platform.
If Broker A receives a price update slightly earlier than Broker B, the two charts can temporarily show different prices. If the market moves sharply during that interval, the difference can become visible in the candle high or low.
This is one reason the effect is often more noticeable during major economic announcements.
For a deeper explanation, see why forex prices can jump between consecutive quotes.
7. Server Time and Daily Candle Cut-Offs Can Change the High and Low
Not every broker defines a trading day using the exact same server clock.
For example, if one broker’s daily candle rolls at one time and another broker’s candle rolls at a different time, the candles are built from different time windows.
The actual market may have traded at the same prices, but the daily candle high and low can appear different because the two candles cover different periods.
This is particularly important when comparing:
- Daily highs and lows
- Previous-day high and low
- Weekly highs and lows
- Session highs and lows
- Daily pivot levels
- Opening-range calculations
8. Time Zones Can Change Technical Levels
Time-zone differences are closely related to server-time differences.
If a trader calculates a previous-day high using a broker whose trading day ends at one time, the result may not match a trader using another broker’s daily candle.
This can lead to apparent differences in:
- Previous-day high
- Previous-day low
- Daily open
- Pivot points
- Session ranges
- Asian, London and New York session levels
Therefore, when a trading strategy depends on daily or session levels, use a consistent data source rather than switching between brokers without accounting for the candle structure.
9. Market Reopening and Rollover Can Increase Differences
Price-feed differences can become more noticeable when liquidity is temporarily reduced.
At rollover and around market reopening, liquidity providers can adjust their pricing, spreads can change and the number of competitive quotes available at each level can fall.
One broker may update its stream differently from another during that period.
This is also why traders should understand why forex price gaps are more common around market reopening.
10. Major News Can Make Broker Highs and Lows Diverge
News releases are one of the easiest situations in which to observe different broker prices.
During a major release, liquidity providers can rapidly change their quotes. Some prices may disappear, spreads can widen and the market can move through several price levels between updates.
If one broker receives a particular quote during a fast move and another does not, their candles may record different extremes.
The difference can be only a few fractional pips on a major pair, but it can be enough to affect a very precise stop or breakout level.
11. Thin Liquidity Can Make Differences Larger
Liquidity is not equally strong at every time of day or every price level.
When fewer participants are actively providing liquidity, the market can become more sensitive to relatively small order imbalances. Spreads can widen and available quotes can change more quickly.
This is why differences between broker charts may become more obvious during:
- Late Friday trading
- Sunday market reopening
- Daily rollover
- Major news releases
- Public holidays
- Less-liquid currency pairs
- Periods of extreme market volatility
Market depth can provide additional context. See what forex market depth means and whether it matters.
12. Why One Broker May Trigger Your Stop While Another Does Not
This is a common real-world example.
Suppose you place a sell trade with a stop-loss at 1.08320. Broker A briefly quotes an ask or relevant execution price that reaches the stop level, while Broker B never reaches that exact price.
Your trade can therefore be stopped on Broker A but remain open on Broker B.
That does not necessarily prove that Broker A manipulated the chart. The brokers may simply have received or displayed different quotes.
However, if you repeatedly observe unusually large differences, especially during normal liquid conditions, it is reasonable to investigate the broker’s execution policy, price source and historical tick data.
13. Why Forex Highs and Lows Are Not Always the Same as Executed Trades
Another important distinction is between a quoted price and an executed transaction.
A displayed high can represent the highest quote observed by a particular data stream. That does not necessarily mean a large transaction occurred at exactly that price.
Different FX venues can also define market highs and lows using different methodologies. Reference data can therefore differ from a retail broker’s chart data.
This is one reason traders should avoid treating one broker’s candle high as a universal definition of the global forex market high.
14. Why Forex Charts From Trading Platforms Can Differ
Trading platforms such as MetaTrader-based systems can display the price stream supplied by the broker or its connected data infrastructure. The platform is not necessarily creating an independent global forex price.
As a result, changing brokers can change the underlying chart data even when the charting software looks identical.
This is particularly relevant for traders who compare two accounts side by side and expect every candle to match tick-for-tick.
15. Are Different Broker Highs and Lows a Sign of Broker Manipulation?
Not by themselves.
Small differences are normal in a fragmented OTC market. Different liquidity sources, quote timing, spreads and data construction can naturally produce different highs and lows.
The right question is not simply, “Why is Broker A’s high different from Broker B’s high?” The better questions are:
- How large is the difference?
- Did it occur during normal or abnormal market conditions?
- Was the difference on the bid or ask side?
- Were spreads unusually wide?
- Were both brokers using comparable server times?
- Does the difference occur repeatedly?
- Can the broker explain its price source and execution policy?
A one- or two-pip difference during a fast news event is very different from a persistent and unexplained price discrepancy during a highly liquid session.
16. How to Compare Two Forex Brokers Fairly
If you want to determine whether two brokers genuinely have unusual price differences, compare them systematically.
Step 1: Use the same currency pair
Compare exactly the same instrument. EUR/USD on one platform should be compared with the same EUR/USD instrument on the other, not a similarly named CFD or synthetic symbol.
Step 2: Use the same timeframe
Compare identical timeframes and the same candle period.
Step 3: Check server time
Confirm the timezone and daily candle cut-off used by both brokers.
Step 4: Compare bid and ask
Do not compare only the visible chart. Check whether the platform is showing bid prices and whether the ask stream is available.
Step 5: Compare during normal liquidity
First test during a liquid London or New York session before drawing conclusions from rollover or major news.
Step 6: Measure the difference
Record the high, low, spread and timestamp rather than relying on a screenshot.
Step 7: Check execution history
If your concern is a stop-loss or take-profit, compare the actual execution price with the broker’s documented quote and execution records.
17. What Traders Should Do About Different Broker Prices
You generally do not need to panic because two brokers show slightly different highs and lows.
Instead, adapt your analysis to the data source you actually trade.
- Use the same broker feed for backtesting and live execution when possible.
- Do not assume another broker’s exact high or low is your executable level.
- Allow for spread when placing very tight stops.
- Be cautious around high-impact news.
- Understand your broker’s execution and slippage policy.
- Keep server time consistent when using daily levels.
- Do not build a strategy around one tick from an unrelated data feed.
18. Why This Matters for Scalpers and Breakout Traders
The smaller the target, the more important small price-feed differences become.
A swing trader targeting a 200-pip move may not care about a one-pip difference between two feeds. A scalper targeting five pips can care a lot.
Breakout traders can also be affected because a tiny difference may determine whether a candle technically breaks a previous high or low.
Execution quality matters even more when volatility rises because slippage can increase during extremely high market volatility.
Broker Price Differences vs Genuine Market Gaps
Do not confuse a difference between two broker charts with a genuine forex price gap.
A broker-to-broker difference means the feeds recorded different prices or constructed candles differently. A genuine market gap refers to a discontinuity in the available market pricing between two points in time.
The distinction matters when analysing support, resistance, stop placement and historical price behaviour.
Why Different Forex Highs and Lows Can Actually Be Useful
Price-feed differences can also teach traders something important: there is no single retail chart that represents every part of the global OTC forex market.
Professional traders often care about the quality and provenance of market data because execution decisions depend on the exact liquidity pool and price source being used.
Instead of asking which chart is the “real” forex chart, it is more useful to understand what each feed represents and whether it is appropriate for the trading decision you are making.
Final Takeaway
Two forex brokers can show different highs and lows without either broker necessarily doing anything wrong. Forex is a fragmented OTC market, and brokers can receive prices from different liquidity providers, aggregate quotes differently, use different server times, display different bid/ask streams and process fast market updates at slightly different times.
Small differences are particularly common around news releases, rollover, market reopening and thin liquidity. They matter most for scalpers, breakout traders and anyone using very tight stops.
The practical solution is simple: trade and analyse using the same price feed consistently, understand whether your chart uses bid or ask pricing, check server time, and judge unusual discrepancies using actual execution data rather than screenshots alone.
Frequently Asked Questions
Why do two forex brokers show different daily highs?
They may use different liquidity providers, price feeds, spreads, quote timing or daily candle cut-off times. A small difference is normal in OTC forex.
Why are forex lows different between brokers?
Different bid prices, ask prices, liquidity sources and tick timing can cause one broker to record a low that another broker never displays.
Which broker has the real forex high?
There is not always one universal retail forex high. Different venues and data providers can record different prices. Reference data and the broker’s executable feed can also differ.
Can different broker prices affect stop-losses?
Yes. A stop can trigger if the relevant executable bid or ask price reaches its level on one broker’s feed even if another broker never reaches that level.
Why do broker charts differ during news?
News can cause rapid repricing, wider spreads, changing liquidity and different quote-update timing. These effects can make broker charts diverge temporarily.
Should I use one broker’s chart for technical analysis and another broker for execution?
You can, but you should understand the differences. For precise levels, backtesting and tight-stop strategies, using the same or a closely matched data source for analysis and execution is usually more consistent.
Do different forex prices mean my broker is manipulating the market?
No. Small differences are normal because FX pricing is fragmented. Persistent or unusually large discrepancies during normal market conditions deserve investigation, but a different high or low alone is not proof of manipulation.
Further Reading
For additional background on fragmented FX pricing, liquidity and market data, see the BIS research on the fragmented spot FX market and CME Group’s material on FX market pricing and reference data.

[…] our guide on why two brokers can show different forex highs and lows for a deeper explanation of price-feed […]
[…] has previously covered related broker-feed differences in Why Two Brokers Can Show Different Forex Highs and Lows and Why Your MT5 Chart Price Can Differ From Another […]
[…] has covered this issue in Why Two Brokers Can Show Different Forex Highs and Lows and How Broker Price Feeds Are Built From Liquidity […]