
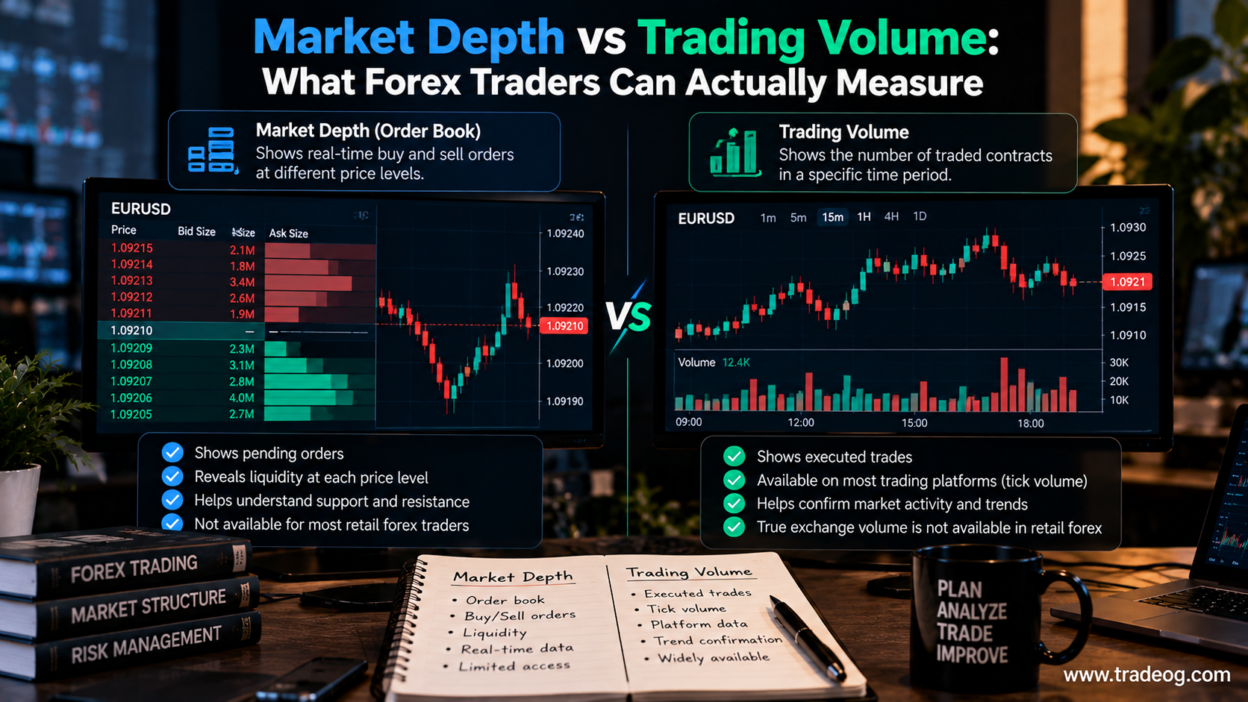
Market depth and trading volume are often shown side by side on trading platforms, but they answer different questions. Market depth describes orders available at different prices in a particular order book or liquidity venue. Volume describes trading activity over a period, although the exact meaning of “volume” depends on the market and data source.
That distinction matters in forex. Spot FX is a decentralised over-the-counter market, not one central exchange with a complete public record of every trade and resting order. Retail traders can often access tick volume, and some platforms provide depth-of-market displays, but neither should automatically be treated as a complete picture of global forex activity.
What market depth actually shows
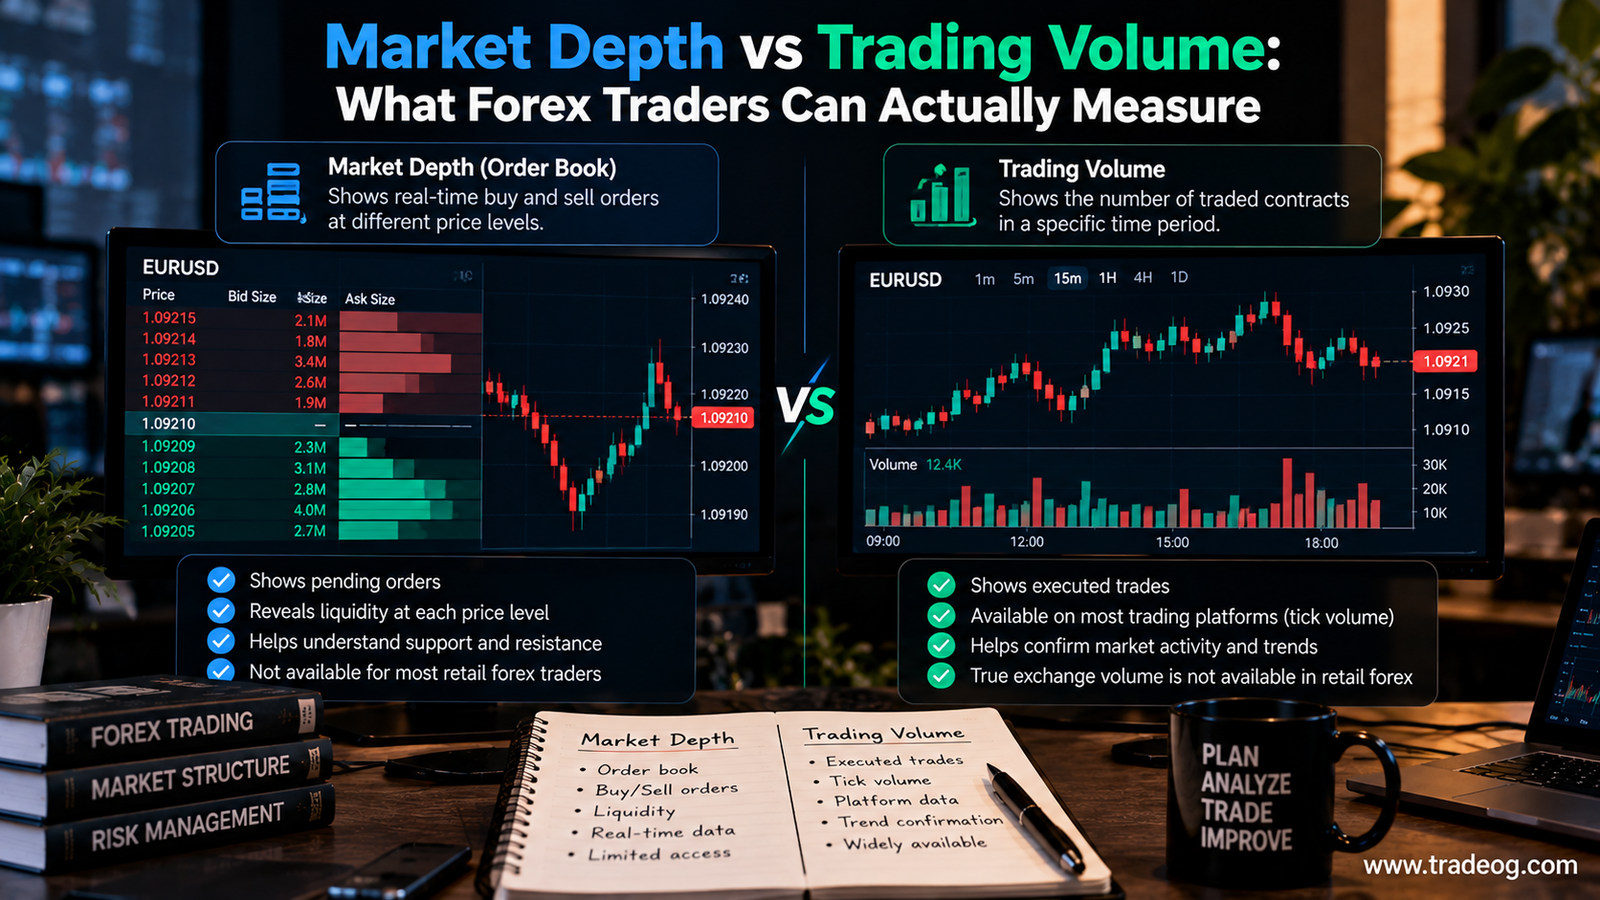
Market depth, sometimes called depth of market or an order book, displays available buy and sell interest at different price levels. Depending on the venue and platform, it may show bid and ask prices, the size available at each level, and how that displayed liquidity changes as orders arrive, execute or cancel.
For example, a depth display might show more displayed buy interest near one price and more sell interest a few ticks above it. This can help you see the liquidity visible to that feed at that moment. It does not guarantee that the orders will remain there or that the displayed size is available to every trader through every broker.
In spot forex and CFDs, the scope of depth data is especially important. A broker may show liquidity from its own venue, selected liquidity providers or a particular execution environment. It is not necessarily the complete global market. Some retail platforms provide limited or simulated depth displays, so check what the broker says the data represents.
What trading volume measures
Volume usually describes how much trading activity occurred during a period. On a centralised exchange, volume can refer to the number of contracts or shares actually traded. In spot forex, a single consolidated volume figure is generally unavailable because trades occur across many banks, brokers and electronic venues.
Many retail forex charts therefore display tick volume, which counts price changes or quote updates during each bar, according to the platform’s definition. It can be useful as a measure of activity on that feed, but it is not the same as the total number of euros, dollars or lots traded across the entire forex market.
Some brokers may provide trade-volume data for a specific venue or product. In that case, interpret it according to the source’s definition rather than assuming it represents all spot FX activity.
Market depth vs trading volume: the practical difference
| Question | Market depth | Trading volume |
|---|---|---|
| What does it show? | Displayed orders or liquidity at price levels | Trading activity over a defined period or venue |
| Typical display | Bid/ask ladder or order book | Volume bars or reported traded quantity |
| Time perspective | A changing snapshot of available liquidity | Activity accumulated over a period |
| Can it change quickly? | Yes; orders can be added, filled or cancelled | Yes; activity varies from one bar or period to another |
| Forex limitation | Often venue- or broker-specific | Retail tick volume is not consolidated global trade volume |
| Useful for | Understanding visible liquidity and potential execution conditions | Comparing activity across bars on the same data source |
Why forex traders often use tick volume
Tick volume is available on many retail charting platforms even when actual traded volume is not. A bar with more ticks than recent bars indicates that the feed recorded more price updates during that interval. Traders sometimes use this to compare activity during breakouts, session opens or quieter periods.
However, tick volume should be interpreted carefully. It can vary between brokers because their price feeds and update rules differ. A high tick-volume bar does not prove that more contracts changed hands, and a low reading does not tell you how much liquidity is available at a particular price.
For a consistent study, use the same symbol, platform, broker feed and timeframe. Compare tick volume with price movement and the market session, and avoid treating it as a universal measure of global forex participation.
Can market depth predict support and resistance?
Displayed order concentrations may highlight areas where visible liquidity is currently clustered. But they are not guaranteed support or resistance levels. Orders can be cancelled, moved or executed before price reaches them, and displayed liquidity may represent only part of the market.
A large order shown in the book does not automatically mean price will reverse there. It may be absorbed, withdrawn or overwhelmed by incoming orders. Likewise, a thin area of displayed liquidity can suggest that prices may move quickly if aggressive orders arrive, but it is not a standalone forecast.
Use depth as context alongside price structure, volatility and your execution data. If you trade through a retail broker, remember that the displayed book may not match the liquidity available to your specific order.
How to measure what your platform actually provides
You can make a more useful comparison by documenting the source and definition of each data series. Start with these checks:
- Identify the source. Is the data from a central exchange, a broker’s liquidity pool, a single venue or a retail price feed?
- Check the definition. Does “volume” mean executed contracts, lots, tick count or another activity measure?
- Record the time and instrument. Use the same pair, timeframe, session and time zone for comparisons.
- Observe depth changes. Note whether displayed orders remain, are cancelled or are executed as price approaches.
- Compare with actual fills. Track spread, slippage and fill outcomes from your own trades rather than assuming displayed depth guarantees execution.
- Keep samples comparable. Compare similar sessions and market conditions instead of mixing quiet hours with major news releases.
If your platform only provides tick volume, say so in your analysis. Do not label it as actual traded volume. If a depth display does not identify its venue or liquidity source, treat its scope as uncertain until the broker clarifies it.
Example: high volume but shallow visible depth
Imagine a EUR/USD chart shows a strong tick-volume spike during a fast move, while the broker’s depth display shows relatively little liquidity near the current price. These observations are not contradictory. Tick volume records frequent price updates on the feed, while the depth panel shows displayed orders available at selected levels at that moment.
The spike does not prove that global traded volume is unusually high, and the shallow book does not prove that the entire forex market lacks liquidity. Together, the signals may tell you to pay closer attention to spread changes, slippage and the quality of your fills.
Which is more useful for your trading?
Neither market depth nor volume is universally better. They measure different things.
- For execution planning: relevant depth data can provide context about displayed liquidity, but actual fills and broker execution reports remain essential.
- For activity analysis: tick volume can help compare activity on the same feed across time periods.
- For breakout studies: combine price movement and volume behaviour, then test whether the relationship holds on your own data.
- For broker comparisons: do not compare one broker’s tick volume with another venue’s traded volume as though they were equivalent.
Whatever you use, test it against a defined trading question. A chart indicator is valuable only if its data is understood and its interpretation holds up in a repeatable test.
Frequently asked questions
Is forex market depth the same as trading volume?
No. Market depth shows displayed buy and sell interest at price levels for a particular source or venue. Volume records trading activity over a period, and its definition depends on the market and data provider.
Does MT4 or MT5 show real forex volume?
Retail forex charts commonly show tick volume, which counts price updates according to the platform’s rules. Actual traded volume may be available for some exchange-traded products or specific venues, but it should not be assumed to represent all global spot forex trades.
Can market depth show where price will reverse?
It can show concentrations of displayed liquidity, but those orders can change or disappear. Depth is contextual information, not a guarantee of support, resistance or a reversal.
Why does tick volume differ between brokers?
Brokers may use different price feeds, liquidity providers and quote-update processes. Since tick volume is based on activity recorded by a particular feed, the counts can differ.
Risk note: Forex and CFD trading involves substantial risk. This article is educational and does not provide a trading signal or investment recommendation.