
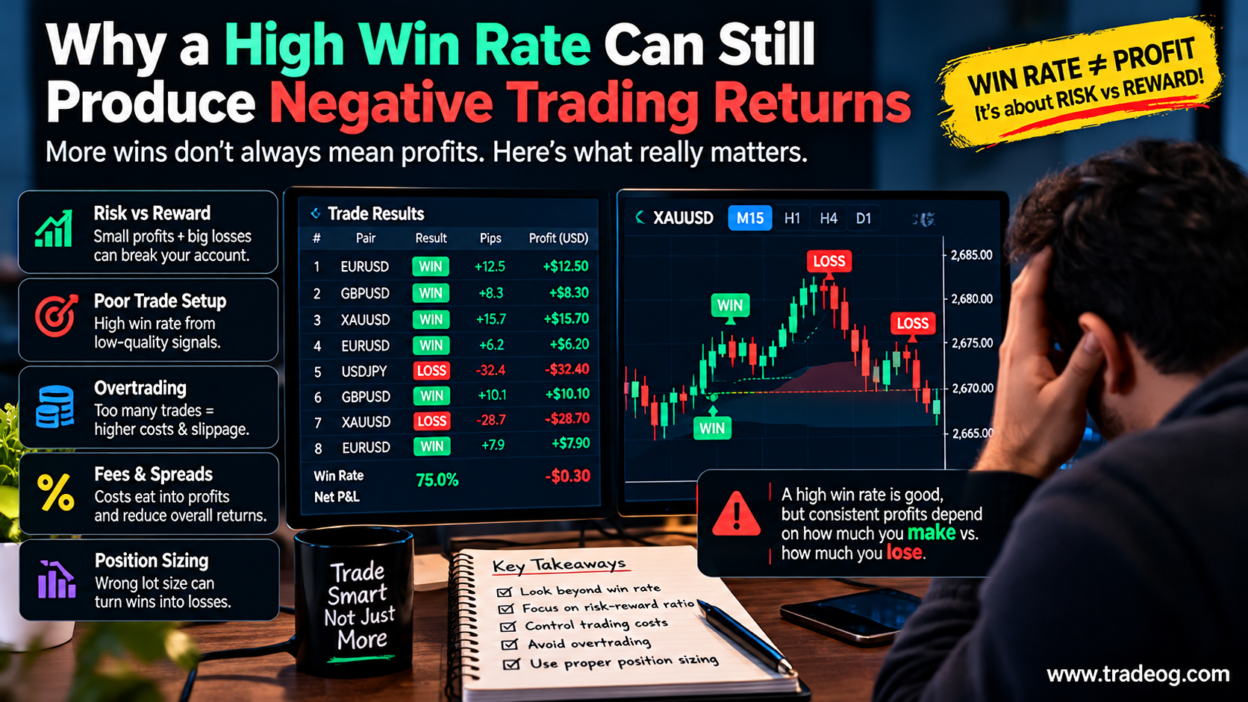
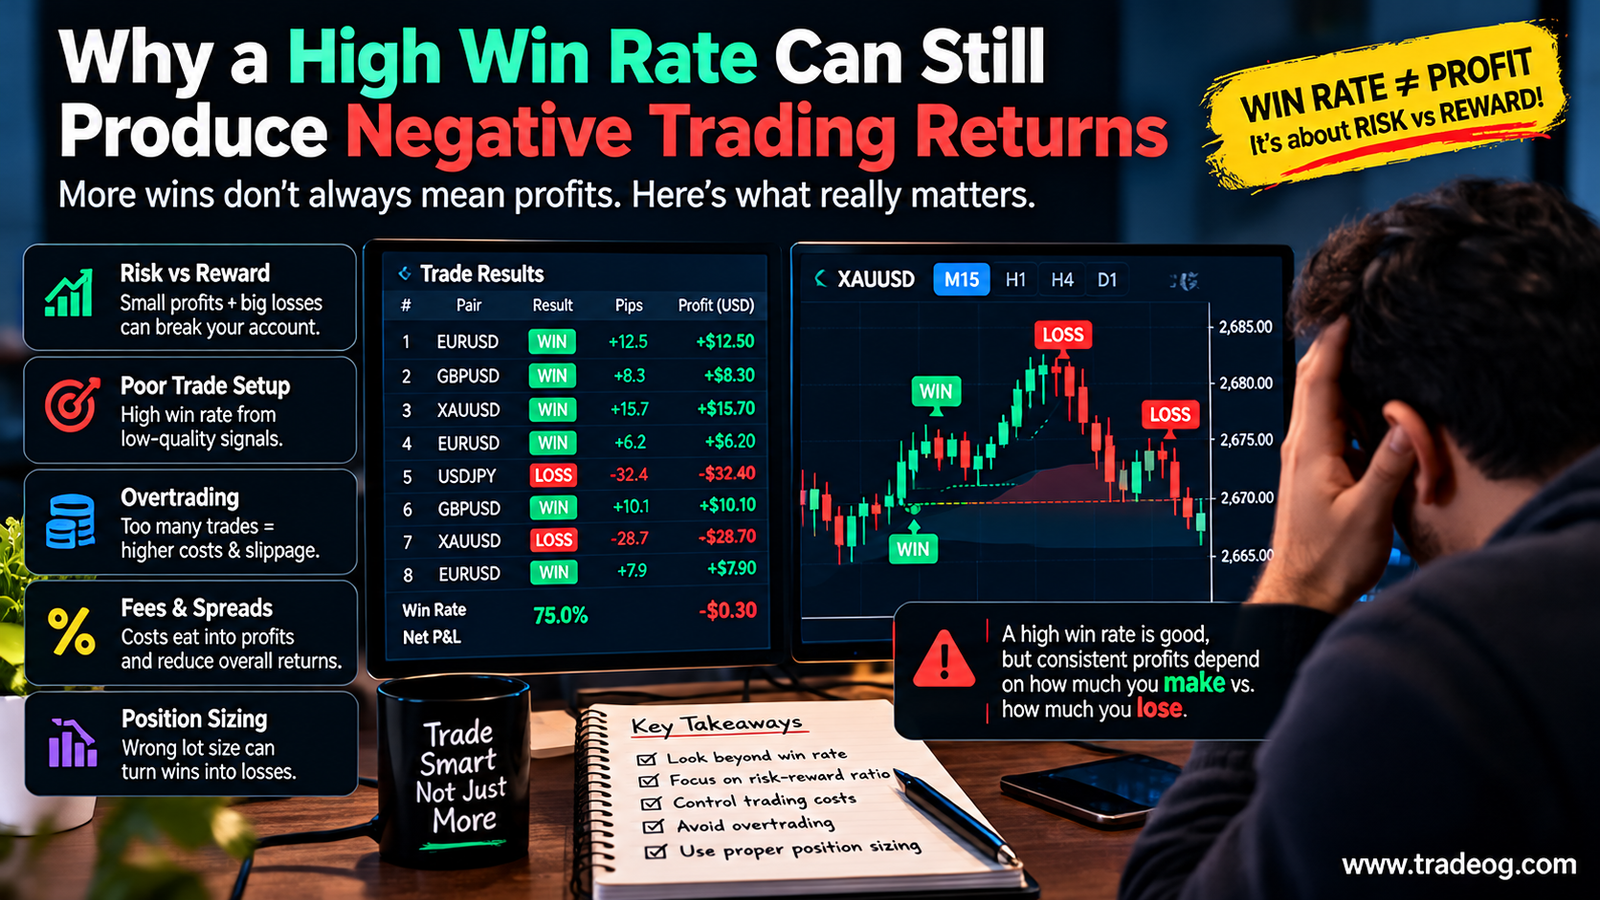
A trading strategy can win seven trades out of ten and still lose money. It sounds wrong at first: if most trades close in profit, shouldn’t the account grow? Not necessarily. What matters is how much you make when you are right, how much you lose when you are wrong, and what you pay to place and manage those trades.
Win rate is useful, but it is only one part of performance. A system that collects small profits and occasionally takes a much larger loss can look consistent for weeks before one bad trade erases the gains. Add spread, commission and slippage, and the gap between a good-looking win rate and a profitable strategy can get wider.
Win rate does not tell the whole story
Win rate is the percentage of closed trades that finish in profit. If 100 trades include 70 winners and 30 losers, the win rate is 70%. That figure says how often the strategy won, but not how large those wins and losses were.
Consider two traders. One makes $10 on a winner and loses $8 on a loser. The other makes $8 on a winner but loses $25 on a loser. Their win rates could be identical, yet their account results would be very different. The average size of wins and losses matters as much as how frequently each occurs.
A simple example: 70% winners, but a losing result
Suppose a strategy takes 100 trades and produces these average results before costs:
- 70 winning trades, averaging +$10 each = +$700
- 30 losing trades, averaging −$25 each = −$750
- Net result before costs = −$50
The win rate is 70%, but the strategy loses $50 before spread, commission or slippage is included. If the average round-trip trading cost were another $1 per trade, the 100 trades would incur $100 in costs, bringing the illustrative result to −$150.
These are example figures, not expected results for any particular strategy. They show why counting winners is not enough: the size of the average loss can outweigh a high number of small wins.
1. Calculate average win and average loss
Start with your realised trade history. Calculate the average profit among winning trades and the average loss among losing trades. Use consistent net or gross figures—if you use net results, make sure the costs already deducted are not added again.
Average win = total profit from winning trades ÷ number of winning trades
Average loss = absolute value of total loss from losing trades ÷ number of losing trades
Compare the two values. If your average win is much smaller than your average loss, you need a sufficiently high win rate to break even. A strategy that targets a few pips while risking many pips needs particularly careful testing because small execution costs can take a meaningful share of each winner.
2. Use expectancy to evaluate the strategy
Expectancy estimates the average result per trade using the win rate and the average size of winners and losers. A simple formula before costs is:
Expectancy = (win rate × average win) − (loss rate × average loss)
Use win rate and loss rate as decimals. For the example above, the win rate is 0.70, average win is $10, loss rate is 0.30 and average loss is $25:
Expectancy = (0.70 × $10) − (0.30 × $25) = $7 − $7.50 = −$0.50 per trade
That is a negative expectancy before costs. To estimate realistic performance, account for trading costs consistently. If the figures are gross of costs, subtract the average cost per trade. If the figures are already net of spread, commission and slippage, do not subtract those costs a second time.
3. Understand the break-even win rate
If your average winning trade and average losing trade are known, you can estimate the win rate needed to break even before costs:
Break-even win rate = average loss ÷ (average win + average loss)
Suppose your average winner is $20 and your average loser is $40. The break-even win rate is $40 ÷ ($20 + $40), or about 66.7%, before costs. A win rate below that level would produce a negative result under those assumptions; trading costs raise the hurdle further.
This is a simplified calculation. Real strategies can have changing trade sizes, variable costs and different distributions of outcomes. Use the formula as a diagnostic, then check the full account history rather than treating one threshold as a guarantee.
4. Small wins can hide occasional large losses
Some strategies close winners quickly but allow losing trades to run. Others use averaging down, add to losing positions or move stops in the hope that the market will turn. These behaviours can create a smooth-looking record with many winning trades, while exposing the account to a small number of damaging losses.
Review the largest losing trades, the average loss and the tail of the loss distribution. Ask whether the worst outcomes fit within the strategy’s stated risk rules. A high win rate is not a substitute for a defined exit plan or a realistic estimate of how much a losing trade can cost.
5. Trading costs can turn a marginal edge negative
Every entry and exit may involve a spread, commission or slippage. Positions held overnight can also incur financing charges. These costs matter especially for scalping and other high-frequency approaches, where the expected profit per trade may be small.
Calculate costs from your actual account records where possible. Compare the spread during the sessions you trade, include commission on the correct basis, and check slippage on both entries and exits. If your backtest assumes perfect fills or a constant low spread, its win rate and net return may not transfer to live conditions.
Be careful not to count costs twice. Some platform profit-and-loss figures already reflect the Bid/Ask spread and realised charges; others show commissions or financing separately. Understand the statement fields before combining them into a net result.
6. Position sizing changes the impact of losses
A strategy can have positive expectancy on paper and still experience serious drawdowns if position sizes are too large. Risking a large fraction of the account on each trade makes a sequence of losses harder to recover from. It can also encourage emotional decisions after a losing streak.
Keep position sizing tied to a defined risk limit and the distance to the stop, while remembering that stops do not guarantee an exact fill in fast markets. Review performance in both money and percentage terms, and include the effect of changing lot sizes. A win-rate statistic without position-size context can be misleading.
7. Check whether the sample is large and representative enough
A 70% win rate over 20 trades is a weak basis for a broad conclusion. A short sample may reflect a favourable market phase or simply random variation. Even a larger sample can mislead if it includes only one type of market condition or excludes trades that were missed, rejected or closed outside the planned rules.
Record all valid signals and orders, including unfilled entries where relevant. Review the strategy across different sessions and volatility conditions, and keep a separate out-of-sample or forward-test period. Avoid repeatedly changing the rules to fit the same historical data, because that can make a strategy appear more reliable than it is.
8. Build a better performance dashboard
Alongside win rate, track these measures for the same period:
- Net profit or loss: after the costs included in your calculation.
- Average win and average loss: to show the typical size of each outcome.
- Expectancy per trade: the average expected result under the measured sample.
- Profit factor: gross profits divided by gross losses, with costs treated consistently.
- Maximum drawdown: the largest peak-to-trough decline in the account or equity curve.
- Cost per trade: spread, commission, slippage and relevant financing.
- Risk per trade: how much account capital is exposed under the trading plan.
These measures answer different questions. Profit factor does not show how smooth the equity curve was, while maximum drawdown does not explain why the losses occurred. Read them together and check the underlying trades before making a decision about the strategy.
What to do if your win rate is high but returns are negative
Do not try to improve the win rate at any cost. First, check whether the average loss is too large relative to the average win. Then inspect trading costs, position sizes, stop discipline and the biggest outlier losses. Finally, retest the strategy using realistic execution assumptions and a separate forward-test sample.
Changing a stop or target simply to make the historical win rate look better can make the overall risk worse. Evaluate any change by its effect on net expectancy, drawdown and consistency—not by the percentage of trades that finish green.
Frequently asked questions
Can a 90% win-rate trading strategy lose money?
Yes. If the average loss is large enough to outweigh the profits from the winning trades, the strategy can have negative returns even with a very high win rate. Costs can worsen the result.
What is a good win rate for forex trading?
There is no single ideal win rate. Its usefulness depends on average win, average loss, costs, drawdown and the strategy’s risk profile. A lower-win-rate system can be profitable if its winners are sufficiently larger than its losses.
Is risk-to-reward ratio more important than win rate?
Neither should be considered in isolation. Win rate and the average size of wins and losses work together to determine expectancy. Trading costs and risk management then affect the results achieved in practice.
Should I change my strategy after a losing streak?
Not based on a losing streak alone. Compare the trades with the strategy’s rules, assess whether the sample is meaningful, and identify whether costs, execution or market conditions explain the result before making changes.
Risk note: Forex and CFD trading involves substantial risk. Past performance and backtested results do not guarantee future outcomes. This article is educational and is not investment advice.