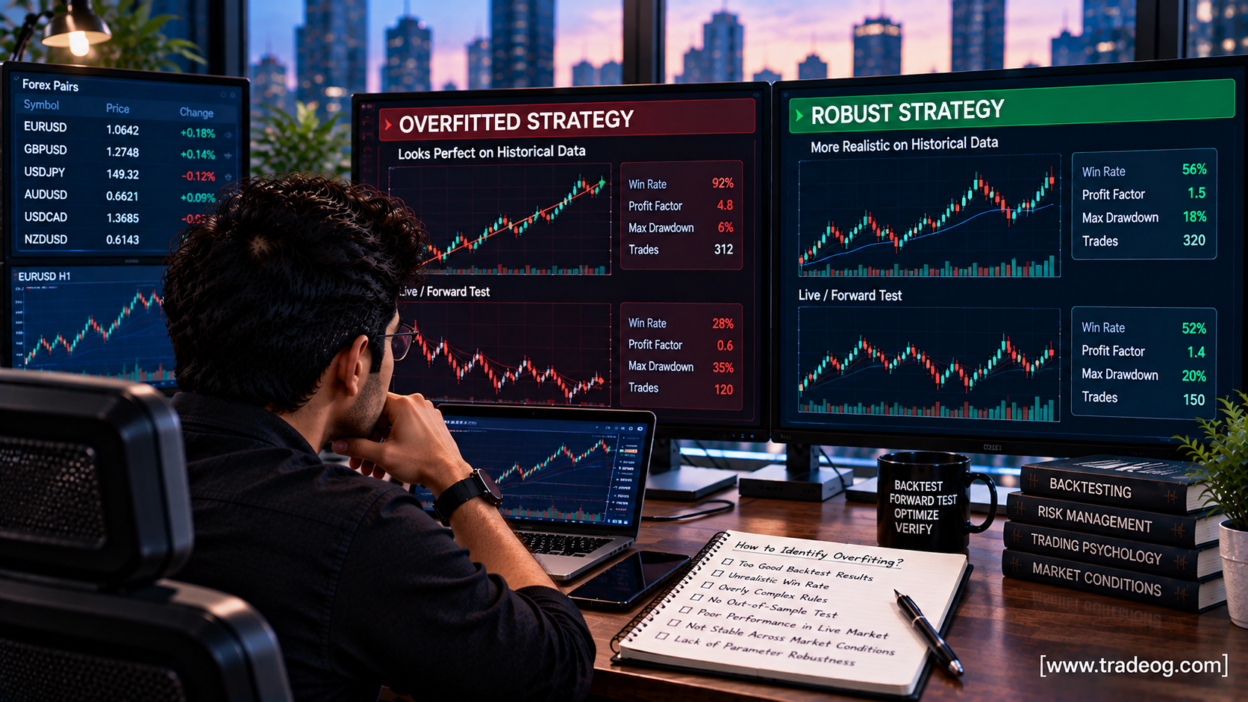
A trading strategy can look almost perfect on historical charts and still fail when you put it into live or unseen market data. One of the biggest reasons is backtest overfitting: the strategy has been adjusted so heavily to historical data that it learns the past instead of capturing a repeatable market behaviour.
This matters for forex, gold, indices, futures and algorithmic trading alike. A strategy with a 90% historical win rate is not automatically better than one with a 55% win rate. If the first strategy was repeatedly optimized until it matched historical price behaviour, its impressive results may disappear out of sample.
Academic research has shown that trying many alternative strategy configurations can materially increase the probability of selecting an overfit backtest. Bailey and colleagues developed the Probability of Backtest Overfitting framework specifically to address this problem. Their research on backtest overfitting explains why exceptional historical performance needs careful validation before capital is allocated.
What Does It Mean When a Trading Strategy Is Overfitted?
Overfitting happens when a strategy becomes too closely adapted to the exact historical observations used during development.
Imagine a trader starts with a simple moving-average strategy. After testing it, they add:
- specific moving-average lengths
- an exact RSI threshold
- a particular ATR filter
- specific trading hours
- a day-of-week filter
- a volatility threshold
- an economic-news exclusion rule
- different stop-loss and take-profit values
Each change may improve the historical equity curve. But after dozens or hundreds of experiments, the final strategy may simply be the configuration that happened to fit that particular historical sample.
That is the key distinction: optimization searches for a better rule; overfitting searches until the historical data gives you the result you want.
Why a Great Backtest Can Be Dangerous
Historical data contains trends, ranges, volatility regimes, news events, liquidity conditions and unusual periods. A strategy can accidentally learn these specific patterns.
The danger becomes greater when traders test many variations and only keep the best result. Research on backtest overfitting shows that high simulated performance can become easier to produce as the number of alternative configurations tested increases. Bailey et al. discuss this multiple-testing problem here.
For example, suppose you test 500 combinations of indicators and parameters. Even if most combinations are mediocre, one may produce an unusually attractive historical equity curve purely because it matched the sample particularly well.
The headline backtest does not tell you how many attempts were made to produce it.
7 Signs That a Trading Strategy May Be Overfitted
1. The Backtest Looks Almost Too Perfect
A strategy with a very high win rate, tiny drawdowns and an unusually smooth equity curve deserves investigation rather than immediate confidence.
Real markets contain losing streaks, changing volatility and execution costs. A backtest that appears almost frictionless may be benefiting from assumptions or parameter choices that will not survive outside the sample.
2. Small Parameter Changes Destroy Performance
This is one of the most useful practical tests.
Suppose a strategy works extremely well with an RSI setting of 37 but becomes unprofitable at 36 or 38. That narrow peak can be a warning sign.
A more robust strategy often has a performance plateau, where nearby parameter values produce reasonably similar results.
| Parameter Test | Potential Interpretation |
|---|---|
| RSI 35–40 all work reasonably well | More robust |
| Only RSI 37 works | Possible overfitting |
| Stop loss 20–30 pips performs similarly | More robust |
| Only exactly 23 pips produces strong results | Needs investigation |
3. Results Collapse on Unseen Data
This is one of the strongest warning signs.
Divide your historical sample into at least two conceptual sections: data used to develop the strategy and data kept untouched for validation.
If the strategy performs strongly in-sample but deteriorates dramatically in the untouched period, the historical result may not represent a durable edge.
4. The Strategy Requires Too Many Rules
Complexity is not automatically bad. Some strategies legitimately require several conditions. But every additional rule creates another opportunity to fit noise.
A strategy that says “enter only when these 14 conditions occur simultaneously” should be tested more aggressively than a simple strategy based on a clear market mechanism.
5. Performance Depends on One Small Historical Period
Check where the profits actually came from.
If 70% of the total profit came from one unusually strong six-month period, the headline return may be misleading. Robustness improves when the strategy produces useful results across different market environments rather than relying on one exceptional period.
6. You Tested Hundreds of Ideas but Report Only the Winner
This is a classic selection-bias problem.
If you tested 200 strategies and published the one with the best Sharpe ratio, that result should not be interpreted the same way as a strategy specified before testing and then evaluated once.
The number of trials matters. The Deflated Sharpe Ratio was proposed partly to address performance inflation caused by selection bias, multiple testing and non-normal returns. See the research on the Deflated Sharpe Ratio.
7. Live Results Are Much Worse Than the Backtest
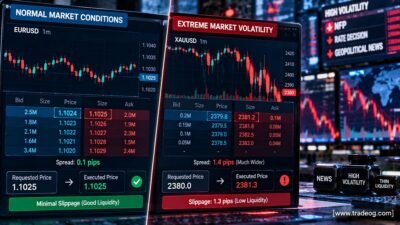
A gap between backtest and live performance does not automatically prove overfitting. Execution costs, spreads, slippage and regime changes can also cause deterioration.
However, a very large and persistent gap is a reason to investigate whether the strategy was too closely fitted to historical conditions.
How to Test Whether Your Strategy Is Overfitted
Step 1: Separate Development and Validation Data
Do not continuously optimize the entire historical dataset and then call the same dataset proof that the strategy works.
Keep a portion of data untouched during development. Once the strategy is finalized, run it on that unseen sample.
The important part is discipline: if you repeatedly modify the strategy after looking at the validation results, that validation set effectively becomes another training set.
Step 2: Use Walk-Forward Testing
Walk-forward testing is particularly useful for strategies designed for changing markets.
A simple structure might look like this:
- Optimize or calibrate the strategy on an earlier window.
- Test it on the following unseen period.
- Move the window forward.
- Repeat the process.
- Combine the out-of-sample results.
This creates a more realistic picture of how a strategy might behave when the future is not known in advance.
Recent research continues to examine how walk-forward validation can diagnose overfitting within conditional trading strategies, reinforcing the importance of testing information that survives outside the development sample. See the 2026 research on walk-forward overfit diagnostics.
Step 3: Test Parameter Stability
Do not only test your chosen parameter combination. Create a grid around it.
For example, instead of testing only a 20-period moving average, test 15, 18, 20, 22 and 25. The objective is not to find the single best number. The objective is to determine whether the strategy remains useful across a reasonable range.
Step 4: Test Different Market Regimes
A strategy should be examined during:
- high-volatility periods
- low-volatility periods
- strong trends
- sideways markets
- major news periods
- quiet sessions
- different calendar years
This connects directly with the issue discussed in our article Why Do Trading Strategies Stop Working During Different Market Conditions?. A strategy can be legitimate but still have a market-regime dependency.
Step 5: Add Realistic Trading Costs
Backtests should account for the costs that a live trader actually experiences.
Depending on the market, this can include:
- spread
- commission
- slippage
- overnight financing or swap
- execution delays
- market-impact assumptions for larger positions
A strategy that makes only a few points per trade can look profitable before costs and become unprofitable after realistic execution assumptions.
For forex traders, this is especially important around volatile news releases and thin liquidity. Our guide on how liquidity affects forex prices explains why execution conditions can change as liquidity changes.
Backtest Overfitting vs a Genuine Trading Edge
| Feature | Potentially Overfit | More Robust |
|---|---|---|
| Historical return | Exceptional | Strong but realistic |
| Parameter sensitivity | Very high | Moderate |
| Out-of-sample result | Large deterioration | Smaller deterioration |
| Rules | Highly complex | Reasonably simple |
| Profit distribution | Concentrated in one period | More diversified across periods |
| Market regimes | Works only in selected conditions | Known strengths and weaknesses |
| Trading costs | Ignored or unrealistic | Included conservatively |
| Validation | Repeatedly optimized | Genuinely unseen data |
A Simple Example
Imagine a trader develops an XAU/USD strategy using 2019–2025 data.
The first version produces a 52% win rate and a 1.35 profit factor. The trader then changes the moving-average length, RSI threshold, trading session, stop loss and take profit dozens of times.
Eventually, one configuration produces:
- 82% win rate
- 3.4 profit factor
- 7% maximum drawdown
- very smooth equity growth
It looks dramatically better.
But when the trader tests the untouched 2026 period, the strategy produces a 44% win rate and a profit factor below 1.
That does not prove the strategy is useless. It does show that the exceptional historical result was not sufficiently reliable to justify assuming the same performance would continue.
A better research process would compare the original strategy, optimized strategy and several nearby parameter combinations across multiple out-of-sample windows.
What About a High Win Rate?
Win rate alone cannot tell you whether a strategy is robust.
A strategy can have a 75% win rate and still lose money if its average loss is much larger than its average win. Conversely, a strategy with a 45% win rate can be profitable when its winners are substantially larger than its losers.
Look at the complete distribution of results:
- profit factor
- maximum drawdown
- average win and average loss
- expectancy
- trade count
- profit concentration
- consecutive losses
- performance by year
- out-of-sample performance
Do not let one attractive statistic become the entire investment thesis.
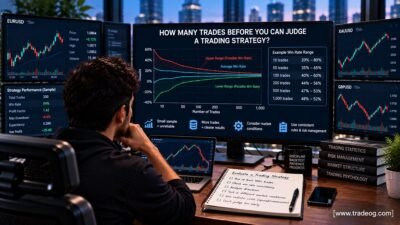
How Many Trades Are Enough?
There is no universal trade-count number that proves a strategy is valid. Required sample size depends on the strategy, market, timeframe, variance and statistical objective.
However, 20 or 30 trades are generally not enough evidence for a complex strategy with many adjustable parameters. More observations can provide a more informative picture, but simply increasing the number of historical trades does not eliminate overfitting.
The quality of the validation process matters as much as the quantity of observations.
Can Machine Learning Make Overfitting Worse?
Yes. Machine-learning systems can be particularly vulnerable because they can search through enormous numbers of possible relationships.
More computational power does not automatically create a better trading edge. If the model is allowed to search aggressively through historical data without strict validation, it can discover patterns that are statistically impressive but economically meaningless.
The same principle applies to ordinary technical strategies. You do not need artificial intelligence to overfit a strategy. A spreadsheet with enough parameters can do it.
A Practical Overfitting Checklist for Traders
Before trusting a strategy, ask:
- Did I keep genuinely unseen data out of development?
- How many strategy variations did I test?
- Did I record failed experiments or only the winning configuration?
- Do nearby parameter values also work?
- Does the strategy work across multiple years?
- How does it behave in trends and ranges?
- How does it behave during high and low volatility?
- Are spread, commission and slippage included?
- Does walk-forward testing remain profitable?
- Did I repeatedly modify the strategy after seeing validation results?
- Are profits dependent on one short historical period?
- Does the strategy have a plausible market mechanism rather than only a beautiful equity curve?
How Indian Forex and Prop-Firm Traders Should Approach It
For Indian traders, overfitting becomes especially dangerous when a strategy is used on XAU/USD, forex or a funded account with strict drawdown rules.
A strategy can appear profitable in a historical simulation while producing a losing streak that violates a prop firm’s daily or maximum drawdown limit in live trading.
Instead of asking, “What settings gave me the highest backtest profit?”, ask:
“What range of settings and market conditions still allows this strategy to behave reasonably?”
That question shifts the objective from historical perfection toward robustness.
Final Takeaway
The easiest way to become suspicious of a trading strategy is not simply to look at a high return. Look at how the return was produced.
A strategy may be overfitted when it has an unusually perfect backtest, depends on extremely precise parameters, contains too many rules, performs poorly on untouched data or changes dramatically when market conditions change.
The strongest defence is a disciplined research process: keep data genuinely unseen, use walk-forward testing, examine parameter stability, test different market regimes, include realistic trading costs and track how many strategy variations were tested.
Backtesting is useful, but a backtest is evidence—not proof. The goal is not to build a strategy that perfectly explains yesterday’s market. The goal is to develop rules that have a reasonable chance of remaining useful when tomorrow’s market is different.
Risk disclaimer: This article is for educational and informational purposes only. Historical or simulated performance does not guarantee future results. Trading forex, gold, futures, CFDs or other leveraged products involves substantial risk, and losses can exceed expectations. Always validate strategies independently and consider your own risk tolerance before trading.