A trading strategy can win far more trades than it loses and still steadily reduce an account balance. This surprises many new traders because a high win rate feels like the clearest sign of a good system.
But win rate is only one part of trading performance. What matters is the relationship between average winning trade, average losing trade, position size, trading costs and the number of trades taken.
A strategy that wins 80% of the time can lose money if its 20% losing trades are large enough to erase all the small gains. This is why professional strategy evaluation focuses on expectancy and risk-adjusted performance, not just the percentage of profitable trades.
Why a High Win Rate Does Not Guarantee Profit
Imagine a strategy takes 100 trades:
- 80 trades win ₹100 each
- 20 trades lose ₹500 each
The winning trades produce:
80 × ₹100 = ₹8,000
The losing trades produce:
20 × ₹500 = ₹10,000
The final result is:
₹8,000 − ₹10,000 = −₹2,000
The strategy has an 80% win rate, yet it loses money.
This is the simplest reason traders should never evaluate a system using win rate alone.
The Most Important Formula: Trading Expectancy
A useful way to evaluate a strategy is expectancy:
Expectancy = (Win Rate × Average Win) − (Loss Rate × Average Loss)
Suppose a strategy has:
- Win rate = 70%
- Average win = ₹200
- Loss rate = 30%
- Average loss = ₹600
Then:
(0.70 × ₹200) − (0.30 × ₹600) = ₹140 − ₹180 = −₹40
The strategy loses an average of ₹40 per trade despite winning seven out of every ten trades.
Now change the average loss to ₹300:
(0.70 × ₹200) − (0.30 × ₹300) = ₹140 − ₹90 = +₹50
The win rate has not changed, but the strategy has moved from negative expectancy to positive expectancy.
Win Rate vs Risk-to-Reward Ratio
Win rate and risk-to-reward ratio work together.
| Win Rate | Average Win | Average Loss | Approx. Expectancy |
|---|---|---|---|
| 80% | 1R | 5R | -0.20R |
| 70% | 1R | 2R | +0.10R |
| 60% | 1.5R | 1R | +0.50R |
| 50% | 2R | 1R | +0.50R |
| 40% | 3R | 1R | +0.60R |
Here, R represents the amount risked on one trade.
This table shows why a 40% win-rate strategy can outperform an 80% win-rate strategy. The lower-win-rate system can make considerably more on its winners relative to its losers.
The Break-Even Win Rate Traders Should Know
If a strategy risks 1R to make 1R, it generally needs to win more than 50% of trades before costs.
If it risks 1R to make 2R, the theoretical break-even win rate falls to about 33.3% before trading costs.
If it risks 1R to make 3R, the theoretical break-even win rate falls to about 25% before costs.
The general relationship is:
Break-even win rate = Average Loss ÷ (Average Win + Average Loss)
For example, with a 1:2 risk-to-reward structure:
1 ÷ (2 + 1) = 33.3%
That does not mean a trader should deliberately target a low win rate. It means profitability depends on the complete payoff distribution rather than one percentage.
How One Large Loss Can Destroy Many Winning Trades
This is common in systems that take frequent small profits but allow losing trades to run.
Imagine an XAU/USD strategy records:
- 17 winning trades averaging +10 pips
- 3 losing trades averaging −110 pips
The winners produce:
17 × 10 = +170 pips
The losses produce:
3 × 110 = −330 pips
Net result:
+170 − 330 = −160 pips
The strategy won 85% of its trades but still lost 160 pips.
This is why a strategy can look psychologically comfortable for weeks and then give back months of small gains during a few large losses.
Profit Factor Is Often More Useful Than Win Rate
Profit factor compares total gross profits with total gross losses:
Profit Factor = Gross Profit ÷ Gross Loss
If a strategy generates ₹120,000 in gross profits and ₹100,000 in gross losses:
Profit Factor = 1.20
If gross profit is ₹120,000 and gross loss is ₹150,000:
Profit Factor = 0.80
A profit factor below 1 means the strategy lost more through losing trades than it generated through winning trades before considering other account-level effects.
Profit factor still should not be viewed in isolation. A strategy with a high profit factor based on a tiny sample can be less convincing than a moderately profitable strategy with a much larger and more diverse sample.
Trading Costs Can Turn a High Win Rate Into a Losing System
Even when the underlying trade distribution has a small positive expectancy, costs can reduce or eliminate it.
Depending on the instrument and broker, traders may face:
- spread
- commission
- slippage
- swap or overnight financing
- conversion costs
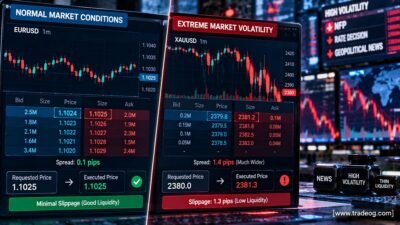
- execution differences during volatile markets
This is especially important for scalping systems that aim to capture small price movements.
For example, if a strategy normally earns an average of 0.2R per trade but execution costs consume 0.15R, the remaining edge may be much smaller than the backtest suggests.
Our guide on how liquidity affects forex prices explains why spreads, slippage and price impact can change as market liquidity changes.
Why High Win Rate Strategies Feel So Attractive
Human psychology plays a major role.
Winning eight trades out of ten feels much better than winning four out of ten. Traders naturally prefer systems that produce frequent positive feedback.
This can encourage a dangerous design choice: moving the stop loss farther away so trades have more time to recover.
The result can be a strategy with many small winners and occasional catastrophic losses.
In other words, the win rate can improve while the risk profile becomes worse.
The Hidden Problem With Moving Stop Losses
Suppose a trader initially risks 1% per trade. A losing trade approaches the stop, but the trader moves the stop farther away because the strategy has a high historical win rate.
If this happens repeatedly, the actual loss distribution no longer matches the original strategy.
A strategy that was profitable with controlled 1R losses can become unprofitable when losses expand to 3R, 5R or more.
Never confuse a higher percentage of closed winning trades with better risk management.
Can a 90% Win Rate Strategy Be Bad?
Absolutely.
Consider a hypothetical strategy with:
- 90% win rate
- average winner = +0.25R
- average loser = −3R
Its approximate expectancy is:
(0.90 × 0.25) − (0.10 × 3) = 0.225 − 0.30 = −0.075R
The strategy loses 0.075R per trade on average.
The impressive 90% win rate hides the fact that the average losing trade is twelve times the size of the average winner.
Why Losing Streaks Still Matter
A profitable strategy can experience losing streaks even when its long-term expectancy is positive.
For example, a strategy with a 60% win rate still has losing trades 40% of the time. Random sequences can produce several losses in a row.
Traders need to understand the expected distribution of losing streaks rather than assuming a high win rate means losses will always be isolated.
This becomes particularly important for funded accounts where daily loss limits and maximum drawdown rules can terminate an account before a strategy’s long-term statistical edge has time to play out.
High Win Rate vs Positive Expectancy
| Metric | What It Tells You |
|---|---|
| Win rate | Percentage of trades that close profitably |
| Average win | Typical size of profitable trades |
| Average loss | Typical size of losing trades |
| Risk-to-reward | Relationship between planned risk and reward |
| Expectancy | Average expected result per trade |
| Profit factor | Gross profits relative to gross losses |
| Maximum drawdown | Largest peak-to-trough decline |
| Trade count | How much evidence supports the statistics |
A serious strategy evaluation should examine all of these together.
How to Evaluate a High Win Rate Strategy Properly
1. Calculate Average Win and Average Loss
Do not stop at the win percentage. Record the average monetary and R-multiple result of both winning and losing trades.
2. Calculate Expectancy
Use the actual trade data rather than assumptions.
Expectancy = (Win Rate × Average Win) − (Loss Rate × Average Loss)
3. Check Profit Factor
Compare total profits with total losses. Then examine whether the result remains reasonable after costs.
4. Study Maximum Drawdown
A strategy can have positive expectancy and still be unsuitable for an account if its drawdown is too large.
5. Look at the Worst Trades
Ask how much damage the worst 1%, 5% or 10% of trades can cause.
If a handful of losses account for most of the strategy’s total losses, investigate whether those trades are properly controlled.
6. Test Different Market Conditions
A strategy may have an excellent win rate during low-volatility markets and perform poorly during major news or strong trends.
Our previous article on why trading strategies stop working during different market conditions explains how market regimes can change strategy behaviour.
7. Check for Overfitting
A very high win rate can also be a warning sign when it appears only after extensive historical optimization.
Test the system on genuinely unseen data and examine whether its performance survives outside the development sample. See our detailed guide on how traders can tell whether a strategy is overfitted to historical data.
What Indian Traders Should Watch
Indian traders using forex, XAU/USD, futures or funded accounts should evaluate strategy performance in the actual conditions in which they trade.
A backtest may show a high win rate, but the live result can differ because of spreads, slippage, execution timing, market-session differences and currency conversion.
If the strategy trades frequently, even small costs can accumulate. If the strategy trades around major US economic releases, execution conditions can change rapidly.
For prop-firm traders, the issue is even more important. A high win rate does not protect an account from a single oversized loss that breaches a daily loss or maximum drawdown limit.
What a Healthy Strategy Report Should Show
Before trusting a strategy, try to collect at least the following:
- total number of trades
- win rate
- average winning trade
- average losing trade
- expectancy
- profit factor
- maximum drawdown
- largest single loss
- largest winning trade
- consecutive wins and losses
- performance by month and year
- results before and after trading costs
- out-of-sample results
This gives a much more complete picture than a statement such as “my strategy wins 85% of the time.”
Final Takeaway
A high win rate does not equal a profitable trading strategy.
Profitability comes from the relationship between win probability, average win, average loss, position sizing and trading costs.
A strategy that wins 80% or 90% of its trades can still lose money when its losing trades are disproportionately large. Conversely, a strategy that wins only 40% or 50% of trades can be profitable when its winners are sufficiently larger than its losses.
The better question is not:
“How often does this strategy win?”
Ask instead:
“How much does it make when it wins, how much does it lose when it loses, and what happens after realistic costs?”
That is the difference between judging a strategy by its marketing headline and evaluating it like a trading system.
Risk disclaimer: This article is for educational and informational purposes only. Historical, simulated or backtested performance does not guarantee future results. Trading leveraged financial products involves substantial risk, and losses can be significant. Always assess position sizing, drawdown and risk tolerance independently before trading.