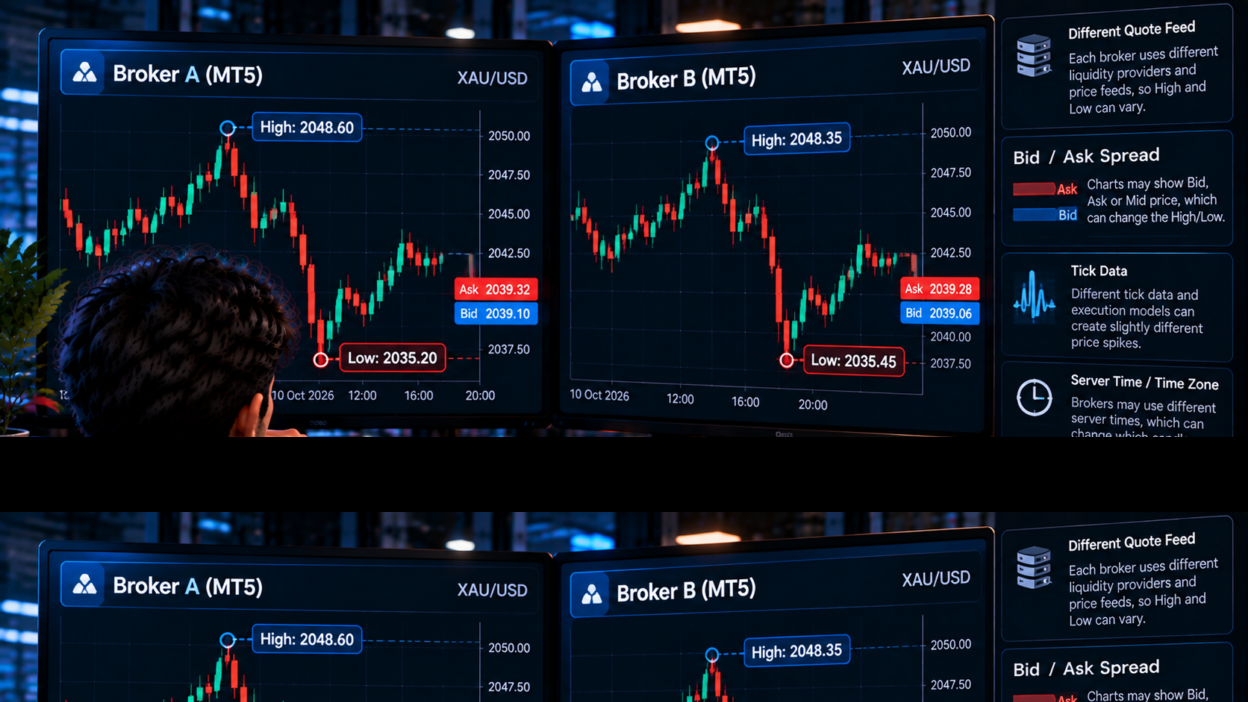
If you compare XAU/USD on two different MetaTrader 5 accounts, you may notice something that looks wrong at first: Broker A shows a daily high of 2048.60 while Broker B shows 2048.35. One broker may also show a low that is several points higher or lower than the other.
This does not automatically mean one broker has incorrect data. MT5 is the trading platform, not a single global price source. For OTC instruments such as spot gold, brokers can receive and aggregate quotes from different liquidity providers and maintain their own trading servers. MetaTrader 5 documentation explains that OTC quotes are supplied through broker pricing streams and that charts are formed from the quotes received by the platform. MetaTrader 5 price-data documentation provides the underlying mechanics.
For XAU/USD traders, understanding this matters because highs and lows are often used for support, resistance, breakout entries, stop placement, liquidity analysis and backtesting. A small difference in the recorded extreme can therefore change the conclusion of a trade setup.
Quick Answer: Why Are XAU/USD Highs and Lows Different?
XAU/USD high and low prices can differ between MT5 brokers because each broker may have a different liquidity feed, price aggregation process, bid/ask spread, tick stream, server time, trading session configuration and symbol specification.
There is no rule requiring every MT5 broker to print exactly the same XAU/USD tick at exactly the same moment.
MetaTrader 5 itself explains that OTC markets use broker-provided Bid and Ask streams rather than a single exchange-wide transaction feed. It also states that one-minute bars for OTC symbols are formed from Bid prices. Read the MT5 price-data documentation.
1. MT5 Does Not Create One Universal XAU/USD Price
This is the first concept to understand.
When you open XAU/USD in MT5, the terminal is displaying the price information supplied by your broker’s trading server. The broker may obtain prices from one or more liquidity providers, aggregate them, apply its pricing model and then distribute the resulting quotes to clients.
Therefore:
- Broker A can receive one sequence of ticks.
- Broker B can receive another sequence of ticks.
- Both can be quoting the same underlying gold market.
- The recorded high and low can still differ.
MetaTrader 5 describes OTC markets as networks where banks, prime brokerages and other market participants provide or aggregate prices for clients. This is fundamentally different from an exchange where a central venue records executed trades. MT5’s official price-data explanation.
2. Different Liquidity Providers Can Produce Different Extremes
Imagine two brokers receiving quotes from different liquidity sources during a fast XAU/USD move.
Broker A receives a brief tick at 2048.60.
Broker B’s feed never reaches that price and tops out at 2048.35.
Both charts can legitimately record different highs.
The same applies to lows. If one broker receives a brief bid of 2035.20 and another receives a lowest bid of 2035.45, the two MT5 charts can show different daily lows.
This difference becomes more noticeable during news releases and rapid markets because prices can change several times within a second.
3. High and Low Depend on the Price Series
High and low are not abstract numbers. They are calculated from a specific price stream.
MetaTrader 5 explains that for OTC symbols, charts are generally formed from Bid prices. It also distinguishes Bid, Ask and Last prices and notes that the available price type depends on the market and instrument. Official MT5 price-data documentation.
This matters because the Bid and Ask are different prices.
For example:
- Bid: 2048.20
- Ask: 2048.45
- Spread: 0.25
If one trader is analysing Bid-based candles while looking at an Ask-related level, the apparent high or low can look inconsistent.
MT5 also provides an option to display the Ask price line because the Ask is not normally visible on a standard chart. The platform documentation specifically notes that bars are formed using Bid or Last prices depending on the instrument, while Ask is used when opening long positions and closing short positions. MT5 chart settings documentation.
4. Spread Can Change the Apparent Extreme
Suppose two brokers have similar Bid prices but different spreads.
Broker A: Bid 2048.20 / Ask 2048.45
Broker B: Bid 2048.20 / Ask 2048.70
The chart’s Bid high can still be identical, but the executable Ask price is very different.
For traders analysing short positions, stop losses or breakout conditions, that difference can matter. A short position is normally closed using the Ask price, while a long position is normally closed using the Bid. MT5’s trading documentation describes this Bid/Ask relationship for current position pricing. MetaTrader 5 execution documentation.
During volatile periods, spreads can also expand. That can make broker-to-broker differences more obvious even when the underlying gold market has not changed dramatically.
5. Tick Data Is Extremely Important for XAU/USD
A candlestick is built from the price observations received during the candle’s time period. If two brokers receive different ticks, the resulting candle can have a different high or low.
Consider a 15-minute candle:
- Broker A receives a brief high at 2048.60.
- Broker B receives no tick above 2048.35.
- Both brokers finish the candle around 2042.50.
The candles may look almost identical, yet the recorded highs are different.
This is particularly important for automated strategies. An EA running on Broker A may detect a breakout above 2048.50 while the same EA on Broker B does not, simply because the tick stream is different.
MT5 stores one-minute bars and uses them to construct higher timeframes, while live quotes continue to arrive from the trading server. MT5 chart documentation explains how history is downloaded and how charts are constructed from broker-provided data.
6. Broker Server Time Can Change Which Candle Contains the High or Low
This is one of the most overlooked reasons for apparently different XAU/USD levels.
Two brokers can use different trading-server time zones. If your daily candle starts at a different hour on each broker, the same underlying price movement can be grouped into different daily candles.
For example, a gold spike at 23:58 broker time could belong to one broker’s current daily candle but another broker’s previous daily candle.
The actual price spike did not necessarily change. The candle grouping changed.
MetaTrader 5’s Market Watch documentation notes that quote arrival times are specified according to the broker’s trading-server time zone. MT5 Market Watch documentation.
This becomes especially important when traders compare:
- Daily highs and lows
- Previous-day high and low
- Asian-session ranges
- London-session ranges
- New York-session ranges
- Daily pivot calculations
7. Different Trading Sessions Can Create Different Daily Ranges
If Broker A’s server day and Broker B’s server day start at different times, the phrase “today’s XAU/USD high” may not represent exactly the same time window.
That can make one broker’s previous-day high appear above another broker’s previous-day high even when both brokers are broadly tracking the same gold market.
For intraday traders, the solution is simple: when comparing levels, compare the same UTC time window rather than blindly comparing the daily candle printed by two different brokers.
8. News Spikes Can Make Broker Differences Much Larger
XAU/USD can move very quickly around major U.S. economic releases, Federal Reserve events, inflation data, employment reports and unexpected geopolitical developments.
During these moments, liquidity can change rapidly and price feeds can behave differently.
One broker may receive a short-lived tick that another broker never receives. One may widen its spread more aggressively. Another may aggregate quotes differently.
The result can be noticeably different highs and lows on the same 1-minute or 5-minute candle.
That does not by itself prove that either broker manipulated the chart. The correct investigation is to compare the broker’s tick history, bid/ask data, timestamps and execution records.
9. Why One Broker Can Show a Breakout and Another Does Not
Imagine resistance is at 2048.50.
Broker A records a high of 2048.62.
Broker B records a high of 2048.44.
A trader using Broker A may classify the move as a breakout. A trader using Broker B may classify it as a rejection below resistance.
Both conclusions can be internally consistent with the data visible on their respective platforms.
This is why extremely precise breakout strategies can be sensitive to the broker’s price feed.
It is also why a strategy should ideally be tested on the same broker or a representative feed rather than assuming that every XAU/USD chart is interchangeable.
10. Why Support and Resistance Levels Can Look Different
Suppose yesterday’s high is:
Broker A: 2050.10
Broker B: 2049.82
If your strategy uses the previous day’s high as a breakout trigger, the entry condition can occur at different prices or at different times.
The same issue affects:
- Previous-day high/low strategies
- Liquidity sweep strategies
- Break of structure systems
- Fair value gap analysis
- Support and resistance indicators
- Pivot-point calculations
- Automated breakout EAs
The smaller the timeframe, the more important the underlying tick data becomes.
11. MT5 Broker Differences Do Not Automatically Mean Bad Data
Seeing different XAU/USD highs and lows is not enough evidence to conclude that a broker’s feed is wrong.
For OTC gold, there is no single exchange tape forcing every retail broker to display the identical quote history. MetaTrader 5 explicitly describes OTC pricing as broker-provided Bid and Ask streams rather than a centralized exchange transaction feed. MT5 official documentation.
However, large or unusual discrepancies are worth investigating, especially if they repeatedly appear around your order levels.
12. How to Compare XAU/USD Between Two MT5 Brokers Properly
If you want a meaningful broker comparison, use the following process:
- Use the exact same symbol. One broker might use XAUUSD while another uses XAUUSD., GOLD, XAUUSDm or another suffix. The specifications may differ.
- Use the same timeframe. Compare 1-minute with 1-minute, 15-minute with 15-minute and so on.
- Check server time. Record each broker’s trading-server time zone.
- Align the time window. Convert both feeds to UTC before comparing daily or session ranges.
- Check Bid and Ask. Do not compare a Bid-based chart with an Ask-based execution level without accounting for the spread.
- Compare tick history when possible. A candle alone hides the individual ticks that created its high and low.
- Check contract specifications. Digits, point size, trading hours, spread type and execution conditions can vary.
- Compare during both quiet and volatile periods. A feed that looks similar in normal conditions may diverge during major news.
13. What XAU/USD Traders Should Do
If you trade manually, do not panic every time two MT5 charts show a slightly different high or low. Instead, understand which price feed your strategy depends on.
If your setup uses a structural level that is several dollars away, a small feed difference may be irrelevant.
If your system depends on a 10-cent breakout, a few cents of feed variation can be significant.
For automated trading, the issue is even more important. Backtesting on one broker and executing live on another can produce different entries, exits and performance because the historical price stream is not identical.
For XAU/USD, broker-specific testing is often more useful than assuming a universal gold chart.
Frequently Asked Questions
Why does XAU/USD have different highs on two MT5 brokers?
Because the brokers can receive different tick streams, use different liquidity providers, apply different spreads and aggregate quotes differently. Server-time differences can also change which candle contains a price extreme.
Is XAU/USD the same price on every MT5 broker?
No. The underlying gold market is the same, but retail OTC brokers can provide different Bid and Ask quotes. Small differences are normal, particularly during fast markets.
Why is my broker’s XAU/USD low lower than TradingView?
The platforms may use different data feeds and price construction methods. TradingView’s displayed symbol may also represent a different provider from your broker’s MT5 feed.
Can different broker server times change the daily high and low?
Yes. If daily candles begin at different times, the same price movement can be assigned to different daily candles. Always compare equivalent UTC time windows when analysing daily ranges.
Which XAU/USD price should I trust?
For trading and execution, the broker’s own executable Bid/Ask feed is the most relevant reference for that account. For analysis, consistency matters more than finding one supposedly universal retail gold price.
Can different XAU/USD highs affect stop losses?
Yes. If the broker’s executable price reaches a stop while another chart does not show the same extreme, the trade can behave differently. Bid/Ask pricing and spread must be considered.
Related TradeOG Guides
- Why Your MT5 Chart Price Can Differ From Another Broker
- Why the Same XAU/USD Candle Can Look Different on Different Platforms
- Why XAU/USD Can Hit Your Stop Loss Without Breaking the Candle Low
- XAU/USD Spread at Market Open: Why Gold Can Start Expensive
- Spread Expansion vs Slippage: What’s Actually Happening?
Disclaimer: This article is for educational purposes only. Broker pricing, symbol specifications, spreads, trading-server times, liquidity sources and execution conditions can change. Always check the current specifications and pricing information for your own MT5 broker before making trading decisions.