Slippage is one of the most misunderstood costs in trading. A trader may click buy or sell at a displayed price and discover that the actual execution occurs at a different price. During calm markets the difference may be tiny, but when volatility becomes extreme, slippage can increase sharply.
This happens because execution depends on the liquidity available at the moment an order reaches the market. When prices move rapidly, quotes can change or disappear faster than an order can be matched. The result can be a larger gap between the price a trader expects and the price at which the trade is actually executed.
The Bank for International Settlements describes the FX market as decentralized and fragmented, with multiple execution venues, dealers and liquidity providers. Its research also notes that execution algorithms have to balance execution speed, market conditions, available liquidity and market risk.
What Is Slippage?
Slippage is the difference between the expected execution price and the actual execution price.
For example, suppose a trader wants to buy EUR/USD at 1.1050. The order is submitted, but the trade is filled at 1.1053.
The trader has experienced 3 pips of adverse slippage.
Slippage can be:
- Positive: the order executes at a better price than expected.
- Negative: the order executes at a worse price than expected.
- Minimal: the expected and executed prices are almost identical.
Slippage is not automatically evidence that a broker or liquidity provider manipulated a trade. It can be a normal consequence of rapidly changing market conditions and the mechanics of electronic execution.
Why Does Slippage Increase During Extreme Volatility?
1. Prices Move Faster Than Orders Can Be Executed
In a calm market, prices may remain available long enough for an order to be matched near the displayed quote.
During an extreme move, however, the market can move several price increments in a very short period. By the time an order reaches a liquidity provider or execution venue, the original quote may no longer be available.
The order is then matched against the next available price.
This is one of the simplest explanations for sudden execution differences.
2. Available Liquidity Can Change Rapidly
Liquidity is not a fixed quantity sitting permanently at every price.
Market participants continuously change their quotes, order sizes and willingness to provide liquidity. During stressful conditions, some liquidity providers may reduce the amount they are willing to quote or adjust their prices more aggressively.
BIS research shows that very high FX volatility can be associated with weaker trading activity for some market participants, and other BIS work highlights episodes of substantial changes in liquidity conditions during market stress.
When fewer units are available close to the current market price, larger orders can travel further through the available liquidity before being completely filled.
3. Bid-Ask Spreads Can Widen
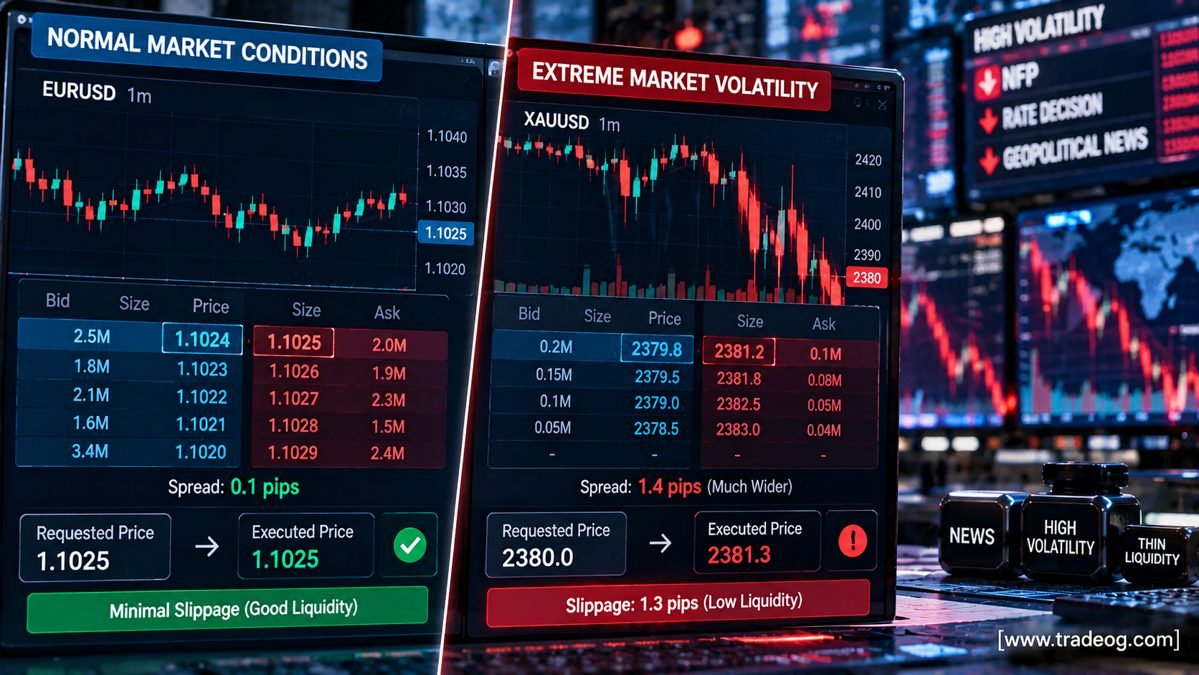
The spread is the difference between the bid and ask price.
During normal conditions, a major FX pair might have a relatively tight spread. During a major news event or sudden market shock, that spread can widen.
A wider spread increases the cost of entering or exiting a position even before additional slippage is considered.
This creates an important distinction:
- Spread: the difference between available bid and ask prices.
- Slippage: the difference between expected and actual execution.
They are different costs, although both can become more significant when market conditions deteriorate.
4. Liquidity Providers Reprice Quotes
Liquidity providers are exposed to market risk when they quote executable prices. If the market is moving rapidly, stale quotes can expose them to adverse selection.
As a result, quotes can be updated quickly.
A trader may therefore see one price on a platform while the executable price has already moved.
BIS research on FX execution algorithms explains that execution models take current market conditions such as available liquidity, volatility and trend into account when determining how aggressively orders should be executed.
5. Market Orders Accept the Best Available Price
A market order generally prioritizes execution rather than guaranteeing a specific price.
If the market is moving rapidly, the best available price when the order is actually matched may differ from the price displayed when the trader clicked the button.
This is why market orders can experience noticeable slippage during extreme volatility.
A limit order provides a price constraint, but it introduces a different risk: the order may not execute at all if the market moves away before reaching the specified price.
News Releases Are a Common Slippage Trigger
Economic announcements can cause unusually fast repricing.
Examples include:
- central-bank rate decisions
- inflation releases
- employment reports
- GDP releases
- unexpected policy announcements
- major geopolitical developments
When new information changes expectations rapidly, market participants can simultaneously attempt to adjust positions. Quotes can move rapidly while available liquidity changes.
The result can be a combination of wider spreads, fast price movement and increased execution uncertainty.
For FX markets specifically, BIS research describes a fragmented execution environment involving dealers, electronic venues and different liquidity providers.
Why Slippage Can Be Worse on Stop-Loss Orders
Stop-loss orders deserve special attention.
Suppose a trader is long XAU/USD and places a stop at 2380.0. The trader may mentally treat 2380.0 as the maximum exit price risk.
But if the market suddenly gaps or moves through that level while liquidity is thin, the actual execution could occur below 2380.0.
The stop has still performed its intended function of triggering an exit, but the execution price may be worse than the stop level.
This is why a stop-loss should not always be interpreted as an absolute guarantee of a specific exit price during extreme market conditions.
Example: Normal Market vs Extreme Volatility
| Condition | Expected Price | Executed Price | Slippage |
|---|---|---|---|
| Calm market | 1.1025 | 1.1025 | 0 pips |
| Moderate movement | 1.1025 | 1.1026 | 1 pip |
| Fast market | 1.1025 | 1.1029 | 4 pips |
| Extreme event | 1.1025 | 1.1040 | 15 pips |
These numbers are illustrative rather than typical guarantees. Actual slippage depends on the instrument, order type, market conditions, liquidity, broker/execution model and order size.
Order Size Can Make Slippage Worse
Slippage is not determined by volatility alone.
Order size also matters.
A small order may be completely filled at the best available price. A larger order may consume the liquidity available at that price and continue into the next price levels.
This is commonly described as market impact.
Execution algorithms are designed partly to manage this trade-off. BIS research explains that execution speed can reduce market risk from waiting, while faster execution can increase market impact; optimal execution therefore involves balancing these competing costs.
Why XAU/USD Can Experience Large Execution Differences
Gold can become particularly fast around major macroeconomic events.
A trader watching a 1-minute XAU/USD chart may see several large candles in rapid succession. During such periods, the displayed chart price and the actual executable bid or ask can change rapidly.
The larger the position, the more important liquidity and execution quality become.
This does not mean gold always experiences worse slippage than every other market. It means traders should evaluate the actual execution characteristics of the instrument and trading session they use.
Does High Volatility Always Mean Low Liquidity?
No.
High volatility and low liquidity are related but different concepts.
A market can experience heavy trading activity and high volatility at the same time. In some circumstances, increased participation can actually provide substantial liquidity.
The important issue is whether enough executable liquidity is available at the prices and speed required by your order.
BIS research on FX volatility finds that the relationship between volatility and trading activity is not simply linear; effects differ by participant and become less favourable at very high volatility levels in the studied market.
Why Charts Can Make Slippage Look Smaller Than It Was
A standard price chart usually displays a simplified price series. It does not necessarily show every executable quote available to a trader at every millisecond.
This matters during fast markets.
A candle might show that price moved from 2380 to 2390, but the chart alone does not tell you exactly which prices were available to your specific order, how long they remained available, or how much liquidity existed at each level.
Execution reports and broker trade records are therefore more useful than simply inspecting a candle after the event.
How Traders Can Measure Their Actual Slippage
Instead of guessing, record your expected and executed prices.
A simple spreadsheet can contain:
- date and time
- instrument
- order type
- requested price
- executed price
- position size
- spread
- market volatility
- news/event status
- slippage in pips or points
After collecting enough observations, compare slippage during calm periods with slippage during high-volatility periods.
You may discover that your average slippage is small most of the time but increases sharply around certain events.
How to Reduce the Impact of Slippage
Trade Smaller During Extreme Conditions
Position size is one of the variables a trader can control. Reducing size can reduce the potential monetary effect of execution differences and market impact.
Avoid Treating News Execution as Normal Execution
If a strategy normally trades in calm conditions, do not assume its historical spread and slippage assumptions remain valid during major announcements.
Use Conservative Backtest Assumptions
A backtest that assumes zero slippage can overstate strategy performance, especially for short-term systems.
Test several realistic slippage assumptions and see whether the strategy remains profitable.
Compare Different Execution Conditions
If you trade through different venues or account types, compare actual execution statistics rather than relying only on advertised spreads.
Understand Your Order Types
Know the difference between market, limit and stop orders and understand what price protection each provides under the rules of your trading platform.
Slippage and Scalping Strategies
Scalpers can be especially sensitive to execution costs because their expected profit per trade may be relatively small.
Imagine a strategy that expects to make 4 pips per winning trade. If average adverse slippage and spread costs consume 2 pips, half of the expected gross movement may disappear before other costs are considered.
This is why a strategy that looks profitable in a clean chart-based backtest can perform very differently in live execution.
Slippage and Automated Trading
Algorithmic systems face the same problem, but at much higher speed.
An automated strategy can submit orders within milliseconds, yet fast execution does not eliminate market impact or liquidity risk.
BIS research notes that execution algorithms can improve the matching process while also transferring execution risks to users and interacting with changing liquidity conditions.
For algorithmic traders, useful metrics include:
- implementation shortfall
- average adverse slippage
- fill rate
- execution latency
- spread at order submission
- spread at execution
- slippage by volatility regime
Does Slippage Mean the Market Is Manipulated?
Not necessarily.
Slippage can occur naturally because markets are continuously repricing and available liquidity changes.
However, traders should still investigate unusual execution patterns. Compare trade records, expected quotes, execution reports and the platform’s order policy rather than automatically assuming either manipulation or perfect execution.
What Traders Should Check Before Trading High-Volatility Events
- How wide is the current spread?
- Is major economic news approaching?
- Has volatility increased sharply?
- Is the instrument liquid at this time?
- How large is the position relative to normal trading size?
- What slippage assumptions were used in the backtest?
- Can the account tolerate a worse-than-expected fill?
- Does the strategy remain viable after conservative execution costs?
Final Takeaway
Slippage tends to increase during extreme volatility because the market can reprice faster than orders can be matched at the originally displayed price.
Rapid price movement, changing liquidity, wider spreads, quote updates, market impact and order size can all contribute to a larger difference between expected and actual execution.
The practical lesson is simple: do not evaluate a trading strategy using chart prices alone. Measure real execution, include realistic slippage and spread assumptions in testing, and understand how the strategy behaves when liquidity and volatility change.
Extreme volatility can create opportunities, but it also changes the cost and reliability of execution. A strategy that works comfortably in normal conditions may have a very different risk profile when markets move at exceptional speed.
Risk disclaimer: This article is for educational and informational purposes only. Trading leveraged financial products involves substantial risk. Execution prices, spreads and slippage can vary significantly between instruments, brokers, venues and market conditions. Historical or simulated execution results do not guarantee future execution quality.