Forex quotes can appear less accurate during extreme volatility because the market is moving faster than individual price feeds can update, liquidity providers are changing their risk, spreads are widening, and different FX venues are producing slightly different prices at the same time. This does not necessarily mean a broker is showing a “wrong” price.
In normal conditions, EUR/USD might update many times per second and the differences between reputable feeds can be tiny. During a major CPI release, central-bank decision, geopolitical shock, flash move or liquidity event, the situation can change rapidly. One venue may update first, another may update milliseconds later, and a retail broker may aggregate or construct its client quote from a particular set of liquidity providers.
This matters because traders can see a chart touch a level that another broker does not show, experience a wider spread, receive a different execution price, or see a stop trigger during a very fast move. The key is understanding how FX pricing actually works rather than assuming every currency pair has one universal live price.
What Is a Forex Quote?
A forex quote normally consists of two prices:
- Bid: the price at which you can generally sell.
- Ask: the price at which you can generally buy.
The difference between them is the bid-ask spread.
For example, a platform might show:
| Quote | Example |
|---|---|
| Bid | 1.0821 |
| Ask | 1.0823 |
| Spread | 0.0002 / 2 pips |
That displayed price is not a universal exchange price. Spot FX is predominantly an over-the-counter (OTC), decentralised and fragmented market. The BIS explains that spot and most FX derivatives trade through dealers and multiple venues rather than through one central exchange. Dealers can internalise customer flow, while participants can access single-dealer platforms, multi-dealer venues, liquidity aggregators and central limit order books.
For TradeOG articles that go deeper into this structure, see How Liquidity Providers Affect Forex Prices and Why Two Brokers Can Show Different Forex Highs and Lows.
Why Extreme Volatility Changes the Quality of Quotes
In a fast market, the central problem is simple: the market can move faster than a quote can remain representative.
Imagine EUR/USD is quoted at 1.0820/1.0822. A major economic release suddenly changes interest-rate expectations. Liquidity providers rapidly reprice their risk:
- One liquidity provider updates to 1.0825/1.0828.
- Another moves to 1.0827/1.0830.
- A third temporarily widens its spread.
- A broker’s aggregator receives the updates at slightly different times.
- Your platform displays the latest consolidated quote available to it.
- The underlying market may already have moved again.
The result can look like an “inaccurate” quote even though it was a genuine price available from a particular source at a particular moment.
This distinction is important. Quote accuracy is not the same thing as price uniformity.
FX Does Not Have One Universal Price
This is the biggest concept traders need to understand.
There is no single central FX order book that every retail broker must use. The BIS describes the FX market as decentralised and fragmented, with trading distributed across different execution methods and venues. In its 2025 survey, global OTC FX turnover reached about $9.6 trillion per day in April 2025, showing the enormous scale of a market that is nevertheless distributed across participants and venues.
Therefore, small differences between quotes can be normal.
During calm conditions, those differences may be almost invisible. During extreme volatility, they can become much more obvious.
What Happens to Liquidity During Extreme Volatility?
Liquidity is not simply the number of trades happening. For a trader, useful liquidity also means having enough two-sided interest to transact without moving the price excessively.
When uncertainty rises, liquidity providers have to manage greater adverse-selection risk. They may:
- Widen bid-ask spreads.
- Reduce the amount they are willing to quote at each price.
- Change prices more frequently.
- Temporarily withdraw a quote.
- Adjust risk limits.
- Reprice after receiving new information.
CME Group notes that headline top-of-book spreads are expected to widen when FX volatility rises and that extreme stress can affect short-term liquidity. Its 2025 analysis also emphasised that liquidity should be assessed using more than one metric, including spread, price continuity, replenishment and traded volume.
So a market can simultaneously have very high trading volume and worse execution conditions. High volume does not automatically mean every individual price level has deep liquidity.
Why Bid-Ask Spreads Widen
Suppose a broker normally quotes EUR/USD at:
1.0820 bid / 1.0821 ask
During a major news release, the quote might become:
1.0820 bid / 1.0826 ask
The spread has expanded from 1 pip to 6 pips.
Why?
The liquidity provider does not know where the market will be a fraction of a second later. Providing a very tight quote while the market is repricing rapidly increases the risk of being hit immediately before the price moves against the provider.
CME’s research on FX trading in volatile conditions shows why traders should evaluate trading ranges relative to spreads rather than looking at spreads in isolation.
Why Your Broker’s Quote Can Differ From Another Broker
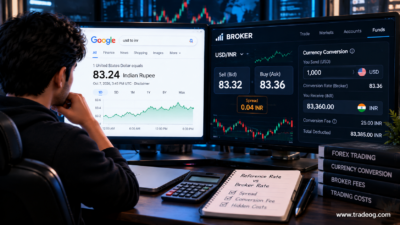
Two brokers can use different liquidity providers, aggregators, pricing models, markup policies and quote-selection algorithms.
Consider:
| Broker | Bid | Ask | Possible reason |
|---|---|---|---|
| Broker A | 1.0821 | 1.0823 | Provider A is currently best on that side |
| Broker B | 1.0820 | 1.0825 | Different liquidity mix or wider risk parameters |
| Broker C | 1.0822 | 1.0826 | Different aggregation and markup |
All three can be displaying legitimate quotes from their own pricing systems.
This becomes especially visible during fast markets. A price can disappear from one feed before another feed has updated.
Quote Latency: The Hidden Problem
Latency is the time required for information to travel from the liquidity source through the broker’s infrastructure to your trading platform.
In normal markets, a small delay may have almost no practical effect.
In a market moving several pips in milliseconds, it can matter considerably.
A simplified chain looks like:
Market participant → liquidity venue → liquidity provider → aggregator → broker → trading server → platform → trader
Every component has infrastructure, networking and processing characteristics.
A displayed chart therefore should not be interpreted as a perfect, instantaneous representation of every transaction occurring globally.
Why Quotes Can Look “Stale”
A stale quote is a price that remains displayed after the underlying market has already moved materially.
For example:
- EUR/USD is displayed at 1.0820.
- A major announcement hits the market.
- Institutional venues rapidly reprice to 1.0830.
- Your platform still displays 1.0820 briefly.
- The feed catches up and jumps to 1.0830.
To the trader, it looks like the price jumped ten pips instantly.
In reality, the market may have moved continuously while the particular display or feed did not update at the same pace.
TradeOG has a related guide on What Causes a Forex Price Feed to Freeze Temporarily?.
Quote Gaps vs Actual Market Gaps
A large difference between two consecutive displayed prices does not automatically mean there was a traditional market gap.
There are several possibilities:
- The market genuinely moved rapidly between transactions.
- The displayed feed missed intermediate updates.
- Liquidity disappeared around a price level.
- The broker changed its quote after a liquidity provider repriced.
- The spread widened dramatically.
- The platform displayed bid prices while the execution depended on ask prices.
These situations can look almost identical on a retail chart.
That is why traders should distinguish between price movement, quote updates and execution prices.
Bid Price vs Ask Price Can Create Confusion
One of the most common misunderstandings occurs when traders compare a chart with an order trigger.
Many retail platforms display the bid price prominently. But:
- A market sell is generally executed against the bid.
- A market buy is generally executed against the ask.
- A buy stop or buy limit depends on the broker’s ask-side conditions.
- A sell stop or sell limit depends on the broker’s bid-side conditions.
This means the price visible on the chart may not be the exact price used to trigger your order.
CME’s 2026 analysis of retail FX/CFD execution explains that retail orders are executed against the broker’s quoted bid/ask stream and that broker policies around execution, slippage and last look can add another layer of execution risk.
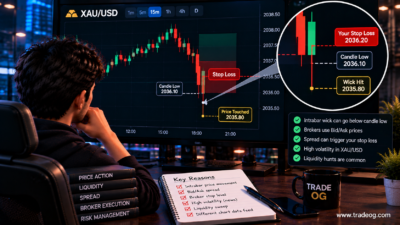
Why Stop Losses Can Trigger During Extreme Volatility
A trader may say:
“The chart never touched my stop, but my position was closed.”
There are several possible explanations.
1. The chart shows bid while the order depends on ask
A buy position is generally closed by selling at the bid, while a short position is generally closed by buying at the ask. The opposite side of the spread may therefore reach the stop first.
2. The spread widened
During a news event, the ask can move substantially above the bid. A short position can therefore be stopped even if the chart’s bid candle does not appear to touch the level.
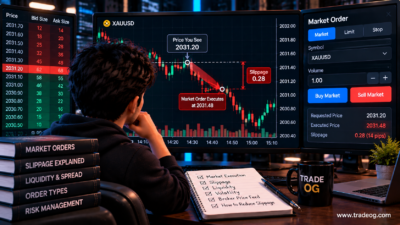
3. Slippage occurred
When the market moves too quickly, the next executable price may be worse than the stop level.
4. Your broker’s feed differs from another broker
A level visible on another broker’s chart is not necessarily the price used by your broker for execution.
Why Slippage Becomes Worse
Slippage is the difference between the price you expected and the price at which the trade actually executes.
Imagine you place a stop at 1.0820.
A fast market jumps from 1.0824 to 1.0817 with insufficient executable liquidity between those prices. Your stop may fill around 1.0817 rather than exactly at 1.0820.
This does not automatically indicate manipulation. It can be a normal consequence of a market moving through available liquidity faster than orders can be filled.
TradeOG’s Why Forex Prices Can Jump Between Two Consecutive Quotes explains this type of fast repricing in more detail.
Why News Events Are Especially Dangerous
Major economic releases create an unusual combination:
- Information changes instantly.
- Algorithms react quickly.
- Liquidity providers reprice risk.
- Order flow increases.
- Some traders cancel resting orders.
- Spreads can widen.
- Price can move through multiple technical levels.
Examples include:
- U.S. CPI
- Nonfarm Payrolls
- FOMC decisions
- ECB decisions
- Bank of Japan decisions
- Unexpected inflation data
- Emergency central-bank announcements
- Major geopolitical developments
The first displayed price after the announcement is therefore not necessarily the price at which every participant could have traded.
Extreme Volatility Does Not Automatically Mean the FX Market Is Broken
This distinction is important.
FX can remain functional while quote quality becomes more variable for an individual trader.
The BIS found that the FX market remained resilient during the April 2025 volatility episode despite very high trading activity. Dealers were able to internalise substantial customer flow, and the analysis did not find clear evidence of broad market dysfunction.
At the same time, CME’s analysis of volatile FX conditions shows that top-of-book spreads can widen and short-term liquidity conditions can change materially.
So the correct conclusion is not “extreme volatility makes forex prices fake.”
The better conclusion is:
Extreme volatility increases the probability that displayed quotes, spreads, available liquidity and executable prices will change rapidly and differ across venues.
Why “The Real Forex Price” Is a Difficult Concept
Traders sometimes search for the one correct EUR/USD price.
But the FX market’s structure makes that concept more complicated than it sounds.
There can be:
- Multiple liquidity providers.
- Multiple dealer prices.
- Different ECNs and trading venues.
- Different bid and ask prices.
- Different execution times.
- Different broker markups.
- Different aggregation algorithms.
The BIS specifically describes FX as a fragmented market with multiple trading venues and execution methods.
Therefore, a better question is not “Which broker has the real price?” but:
“Which executable price is available to me through my broker under the current market conditions?”
How Indian Forex Traders Should Handle Quote Instability
1. Know your broker’s pricing model
Understand whether the broker uses a market-maker model, STP-style routing, multiple liquidity providers, an aggregator or another execution structure. Read the broker’s execution policy instead of relying solely on marketing terminology.
2. Compare bid and ask, not just the candle
If you trade around news, monitor the spread. A candle can look normal while the executable bid/ask has changed significantly.
3. Watch spread expansion
If your normal EUR/USD spread is 0.5–1 pip and it suddenly becomes several pips, your normal scalping assumptions no longer apply.
4. Avoid blindly trading major releases
If your strategy has not been tested under news conditions, do not assume a high-volatility event will improve it.
5. Use appropriate position sizing
A larger expected range should generally lead to smaller exposure if you want to keep monetary risk controlled.
6. Keep records of execution
Save screenshots showing the quote, spread, order ticket and execution price. This is useful if you need to investigate an unusual fill with your broker.
How Prop-Firm Traders Should Think About Extreme Quotes
Prop-firm traders have an additional problem: a temporary spread expansion can interact with strict daily-loss or maximum-drawdown limits.
A setup that normally risks 0.5% can behave very differently during a high-impact release if:
- The spread widens.
- The stop is triggered by the ask/bid side.
- Slippage increases.
- Price moves several pips before execution.
- The firm applies specific news-trading restrictions.
Always read the current rules of the specific prop firm. Do not assume that because an order is technically accepted, the trading activity is permitted under every firm’s terms.
When Are Forex Quotes Most Likely to Become Unstable?
| Situation | Potential quote behaviour | Main risk |
|---|---|---|
| Major CPI/NFP/FOMC release | Rapid repricing, wider spreads | Slippage and stop-outs |
| Unexpected geopolitical news | Fast directional moves | Liquidity gaps |
| Market reopening | Different prices across feeds | Gaps and wide spreads |
| Daily FX rollover | Thinner liquidity and wider quotes | Execution cost |
| Exotic currency pairs | Less continuous liquidity | Large spreads |
| Flash volatility | Rapid quote updates | Latency and slippage |
CME’s September 2026 discussion of the FX daily close provides a particularly useful example: during the New York rollover hour, listed FX futures pause while many retail FX and CFD platforms continue quoting. CME notes that liquidity providers can widen quotes because hedging options become more limited during that period.
How to Tell Whether a Quote Problem Is Broker-Specific
If you experience an unusual quote, investigate systematically rather than immediately assuming misconduct.
- Record the exact date and time.
- Record the currency pair.
- Record the bid and ask shown by your broker.
- Record the spread.
- Check another independent price source.
- Check whether major news was released.
- Check whether the issue occurred during rollover or reopening.
- Review your broker’s execution policy.
- Check the trade’s execution and order history.
- Ask the broker for a timestamped execution explanation if necessary.
A difference lasting a fraction of a second during a major news release is not equivalent to a persistent, unexplained pricing error.
Why Charts Can Be Misleading During Fast Markets
A candlestick compresses a sequence of prices into a visual object. It does not show every quote, every bid/ask change or every executable level.
A one-minute candle might show:
Open → high → low → close
But thousands of quote updates may have occurred during that minute.
This is why traders should avoid using a candle’s wick alone as proof that a particular price was continuously available for execution.
The difference becomes especially important for strategies based on very tight stops, one-pip breakouts or precise news entries.
Does a Different Quote Mean One Broker Is Wrong?
Not necessarily.
If Broker A shows EUR/USD at 1.0821/1.0823 and Broker B shows 1.0822/1.0825, both may be reflecting different executable liquidity.
However, if a broker repeatedly displays a price that is materially inconsistent with reliable market references, or if an execution appears inconsistent with the broker’s published terms, that is worth investigating.
The correct approach is evidence rather than assumption.
Practical Example: CPI Release
Suppose EUR/USD is trading near 1.0820 before U.S. CPI.
At the release:
- Inflation comes in materially different from expectations.
- Rate expectations change.
- Institutional algorithms react.
- Liquidity providers reprice.
- Some quotes disappear.
- Other providers widen spreads.
- EUR/USD jumps through several price levels.
- Your broker aggregates the new prices.
You may see a chart move from 1.0820 to 1.0832 with very few visible intermediate candles.
That does not mean the market “skipped” every price in a literal sense. It means the available displayed and executable liquidity changed so quickly that intermediate prices may not have been available to your particular trading connection.
Quote Accuracy vs Execution Quality
These are two different concepts.
| Concept | Meaning |
|---|---|
| Quote accuracy | How closely a displayed price represents the current executable market for that feed |
| Quote consistency | How closely prices match across feeds or brokers |
| Execution quality | How well your actual order was filled relative to available market prices |
| Spread | Difference between bid and ask |
| Slippage | Difference between expected and executed price |
| Liquidity | Ability to transact without excessive price impact |
A broker can provide a legitimate quote while your execution is still worse than expected because the market moved rapidly before the order was filled.
How Traders Can Reduce the Impact
- Use a reputable broker with transparent execution policies.
- Understand whether the platform displays bid, ask or both.
- Monitor spreads during news.
- Avoid extremely tight stops in unpredictable conditions.
- Reduce position size during major volatility.
- Consider whether you actually need to trade the release.
- Do not rely on a single chart feed to investigate execution.
- Keep execution records for unusual events.
- Test strategies under realistic spread and slippage assumptions.
Final Takeaway
Forex quotes do not necessarily become “wrong” during extreme volatility; they become more difficult to interpret because the market itself is changing faster, liquidity is being repriced, spreads can widen, and different venues and brokers can update at different speeds.
The decentralised structure of FX means there is no single universal retail quote. The BIS describes a fragmented OTC market with multiple dealers and trading venues, while recent CME research shows that volatile conditions can widen top-of-book spreads and alter short-term liquidity without implying that the entire market has stopped functioning.
For Indian traders, the practical lesson is straightforward: do not judge a volatile market only by the candle on your chart. Watch the bid, ask, spread, execution price, liquidity conditions and news environment together.
If a quote looks unusual, investigate the timestamp and market conditions before assuming the broker is at fault. Understanding how prices are formed and delivered can help you distinguish a normal fast-market execution problem from a genuine pricing or execution issue.
FAQs
Why do forex quotes differ between brokers?
Because brokers can use different liquidity providers, aggregators, markups and pricing infrastructure. Since spot FX is decentralised and fragmented, small differences are normal.
Can forex quotes become inaccurate during news?
A quote can become temporarily less representative or stale as the market moves faster than that particular feed updates. This does not automatically mean the quote is false.
Why does the spread widen during volatility?
Liquidity providers face greater risk when prices are moving rapidly. They may quote wider bid-ask spreads or reduce available depth to protect against adverse selection.
Why did my stop trigger when another broker’s chart did not touch it?
Your broker may use a different feed, and the stop may depend on the bid or ask side rather than the price shown on another broker’s chart. Spread expansion can also trigger a stop.
Does slippage mean the broker manipulated my trade?
No. Slippage can occur naturally when available liquidity changes faster than an order can be executed. If an execution looks abnormal, review the timestamp, quote, spread and broker execution policy.
Are forex prices more reliable during normal market hours?
Generally, major currency pairs tend to have deeper and more continuous liquidity during active sessions, but conditions vary. News releases, holidays, rollover periods and geopolitical shocks can still cause instability.
Sources and further reading: BIS: FX Trade Execution Landscape, BIS: 2025 FX Triennial Survey, CME Group: FX Traders and Liquidity During Volatility, CME Group: FX Futures and Spread Risk Around the Daily Close, and CME Group: Retail FX/CFD Execution.