A trading strategy is overfitted when it has been tuned so closely to historical data that its impressive backtest performance does not survive when conditions change or when the rules are tested on unseen data. In simple terms, the strategy may have learned the past rather than discovered a repeatable trading edge.
Overfitting is one of the biggest risks in systematic trading because a backtest can look excellent while live performance is disappointing. A high win rate, smooth equity curve or large historical profit is not enough by itself.
What Is Trading Strategy Overfitting?
Overfitting happens when a trader repeatedly adjusts strategy rules, indicators, parameters, entries, exits or filters until the historical results become unusually attractive.
For example, a trader may test different moving-average lengths, stop-loss distances, profit targets, trading sessions and volatility filters. If hundreds of combinations are tested, it is possible to find one that performed exceptionally well by chance.
That result can be statistically impressive on the development data while having little predictive value for future markets.
Why Backtests Can Look Better Than Live Trading
Historical data gives you the answer before you make the decision. Live trading does not. During development, a trader can unconsciously choose rules because they produced a desirable historical outcome.
The more decisions you make based on the same historical dataset, the greater the risk that the final strategy reflects historical noise.
Warning Sign #1: Too Many Parameters
A strategy with a large number of adjustable parameters deserves extra scrutiny.
Examples include:
- Several moving averages
- Multiple oscillator thresholds
- Different entry windows
- Separate rules for many sessions
- Several volatility filters
- Highly specific stop-loss and take-profit values
- Many exceptions to the core rules
Complexity is not automatically bad, but every additional degree of freedom creates another opportunity to fit historical noise.
Warning Sign #2: Tiny Parameter Changes Destroy Performance
A robust strategy should generally not collapse when a parameter changes slightly.
Suppose a strategy uses a 20-period moving average. If 19, 20 and 21 all produce broadly similar results, that can be healthier than a system where 20 is spectacular but 19 and 21 are dramatically worse.
This is called parameter stability. You are looking for a reasonably broad area of acceptable performance rather than one perfect historical setting.
Warning Sign #3: The Equity Curve Is Suspiciously Perfect
An extremely smooth historical equity curve can be a warning sign, especially when it comes from a highly optimised system.
Real markets contain losing streaks, changing volatility and periods where a strategy performs poorly. A system that appears almost flawless may deserve more investigation rather than immediate trust.
Warning Sign #4: Performance Collapses Out of Sample
One of the strongest tests for overfitting is to evaluate the strategy on data that was not used to develop it.
Split historical data into development and validation periods. Build the strategy using the first section, freeze the rules and then test them without modification on the unseen section.
If performance falls dramatically, investigate whether the original result depended on historical noise.
In-Sample vs Out-of-Sample Testing
| Test | Purpose | What to watch |
|---|---|---|
| In-sample | Develop and evaluate the initial idea | Do not over-optimise |
| Out-of-sample | Test frozen rules on unseen data | Performance deterioration |
| Forward test | Observe the strategy under current conditions | Execution and behavioural differences |
Warning Sign #5: Walk-Forward Results Are Weak
Walk-forward testing repeatedly develops or calibrates a strategy on one historical window and then tests it on the next unseen window. The process is then rolled forward through time.
This can provide a more realistic picture than optimising once over the entire historical dataset because the strategy repeatedly faces data it has not seen during the preceding development period.
A strategy that only performs well in one large backtest but repeatedly struggles in walk-forward validation deserves caution.
Warning Sign #6: The Strategy Works Only in One Historical Period
Suppose nearly all of a strategy’s profit came from a single six-month period. That does not automatically invalidate the system, but it raises an important question: what caused the exceptional performance?
Check whether the strategy works across different:
- Market regimes
- Volatility environments
- Trading sessions
- Trend and range conditions
- Major news periods
- Instruments, where the strategy is intended to be portable
Warning Sign #7: Too Many Rules Were Added After Losing Trades
This is one of the easiest ways to create overfitting.
A trader sees a historical loss and adds a filter designed to prevent that exact loss. Then another filter is added for another losing trade. Eventually, the strategy contains a long list of exceptions that perfectly explain the past.
The problem is that future markets will generate new combinations of conditions that the historical filters never encountered.
Warning Sign #8: High Win Rate but Weak Robustness
A high win rate does not prove that a strategy is robust. A system can achieve a high historical win rate by using very small profit targets, large stop-losses or highly selective historical filters.
Always evaluate expectancy, average win, average loss, maximum drawdown and profit factor alongside win rate.
See also why a high win-rate strategy can still lose money.
Warning Sign #9: Results Depend on Unrealistic Execution
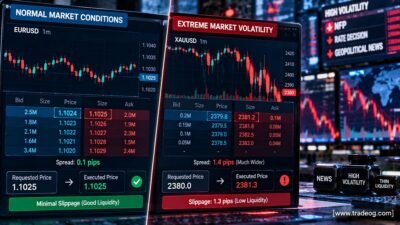
A backtest can be overfitted and unrealistic at the same time. If it assumes perfect fills, zero slippage, fixed spreads or execution at prices that may not have been available, the historical result may be overstated.
This matters particularly for scalping and short-term systems. A strategy with a small edge can lose its advantage after realistic spreads, commissions and slippage.
Warning Sign #10: The Strategy Needs Constant Optimisation
If you feel that the strategy needs to be re-optimised every few weeks to keep working, investigate whether the original edge is robust.
There is a difference between periodically reviewing a strategy and constantly tuning it to recent losses. A robust process should define clear circumstances under which rules are reviewed and should validate any meaningful change on unseen data.
Parameter Stability Test
Instead of searching for one perfect parameter, test a reasonable range.
| Parameter | Fragile result | More robust result |
|---|---|---|
| Moving average | One setting dramatically superior | Nearby settings perform similarly |
| Stop distance | One exact value dominates | A reasonable range remains viable |
| Profit target | One exact target is exceptional | Nearby targets produce comparable results |
| Trading session | One narrow minute window is essential | Performance remains reasonable across the intended window |
Check the Distribution of Profits
Look at where the strategy’s total profit comes from. If a tiny number of trades generate most of the return, the result may be fragile.
Ask:
- What percentage of total profit came from the best five trades?
- Would removing the best trade change the conclusion?
- Are profits spread across many months?
- Are both winning and losing periods represented?
A strategy does not need every trade to be profitable, but its edge should not depend entirely on a handful of extraordinary historical events unless that is an intentional part of the strategy.
Use a Monte Carlo Perspective
Monte Carlo analysis can reshuffle the sequence of historical trades or vary assumptions to examine how sensitive the strategy is to the exact order of outcomes.
This can help estimate possible drawdown ranges and determine whether the historical equity curve may simply have benefited from a favourable sequence.
Monte Carlo analysis does not prove that a strategy will work in the future, but it can expose risk that a single historical equity curve hides.
Test Different Market Regimes
A strategy should be evaluated in the environments relevant to its intended use.
- Strong trends
- Sideways ranges
- High volatility
- Low volatility
- Major news periods
- Quiet sessions
Different strategies naturally have different strengths. The goal is not to force every strategy to work everywhere, but to understand its operating conditions.
Our guide on why trading strategies stop working in different market conditions covers this issue in more detail.
Test Costs Before Trusting the Backtest
Include realistic spread, commission, slippage and financing assumptions where relevant. Compare gross and net performance.
If the strategy has a very small gross edge, modest execution costs can completely change the result.
Use a Holdout Period
A simple robustness test is to keep a portion of historical data completely untouched during strategy development.
Do not inspect the holdout results until the rules are frozen. Once you have looked at the results and changed the strategy because of them, that data is no longer a clean holdout sample.
Do Not Confuse More Data With More Robustness
Thousands of trades do not automatically eliminate overfitting. If the rules were optimised repeatedly against the same data, the system can still be overfit.
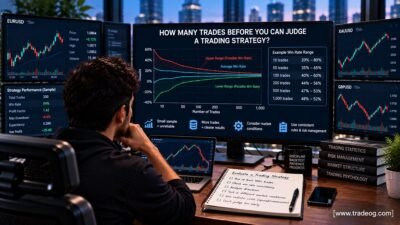
Our article on how many trades are needed to judge a trading strategy explains why trade count and evidence quality are different concepts.
A Practical Overfitting Checklist
- Was the strategy repeatedly optimised on the same historical data?
- Does it contain an unusually large number of parameters?
- Do small parameter changes cause major performance changes?
- Does it fail on unseen data?
- Does walk-forward performance deteriorate?
- Does one historical period generate most of the profit?
- Were filters added specifically to eliminate historical losses?
- Are transaction costs realistic?
- Does the strategy work across relevant market regimes?
- Does it require constant re-optimisation?
Example: An Overfit XAU/USD Strategy
Imagine a gold strategy that uses 14 indicators, five session filters, three volatility thresholds and several exact entry times. The backtest shows a 78% win rate and a very smooth equity curve.
The trader then tests the same rules on a later period and the win rate falls sharply. Small changes to the indicator settings also cause large changes in profitability.
Those are strong reasons to investigate overfitting. The impressive historical result may have been produced by fitting a complex collection of rules to the specific behaviour of the development period.
What a More Robust Strategy Usually Looks Like
Robustness does not mean a strategy never loses. A more credible system generally has:
- A clear economic or market-structure rationale
- A manageable number of parameters
- Reasonable parameter stability
- Acceptable performance across relevant regimes
- Positive results after realistic costs
- Evidence from unseen data
- Forward-testing evidence
- Risk characteristics that fit the trader’s account
When Should You Reject a Backtest?
Reject or redesign the test when the result depends on unrealistic assumptions, excessive optimisation, a tiny number of trades, one unusual historical period or a parameter setting that has no logical reason to be special.
It is better to reject a fragile backtest before risking money than to discover its weakness after a large drawdown.
Frequently Asked Questions
What is the biggest sign of overfitting?
A major deterioration when a strategy is tested on genuinely unseen data is one of the strongest warning signs, especially when combined with excessive optimisation and parameter sensitivity.
Can a simple strategy still be overfit?
Yes. Even a simple strategy can be overfit if its parameters or rules were selected after repeatedly inspecting the same historical results.
Is a high backtest win rate bad?
No. A high win rate is not automatically a problem. It becomes a warning sign when it comes with unrealistic assumptions, fragile parameters or poor out-of-sample performance.
How many trades are needed to detect overfitting?
There is no universal number. You need enough observations to evaluate performance and enough independent data to test whether the rules generalise. A large trade count from one regime is not necessarily robust.
Does walk-forward testing prevent overfitting?
No. It can help detect and reduce some forms of overfitting, but the design of the testing process can itself be over-optimised. Keep the methodology disciplined and transparent.
Final Takeaway
The best way to detect an overfitted trading strategy is to stop judging it by the beauty of its historical equity curve. Look for parameter stability, unseen-data performance, walk-forward consistency, realistic trading costs, multiple market regimes and a limited dependence on exceptional historical trades.
If a strategy remains reasonably effective after the rules are frozen and exposed to data it did not use during development, confidence increases. If performance collapses outside the development sample, treat the original backtest as a hypothesis rather than proof of a durable edge.
TradeOG Disclaimer
This article is for educational and informational purposes only and does not constitute financial, investment or trading advice. Trading forex, CFDs, gold and other leveraged instruments involves substantial risk of loss. Past performance and backtest results do not guarantee future results. Always consider your financial situation, risk tolerance, broker conditions, transaction costs and applicable laws before trading. TradeOG does not guarantee the accuracy, completeness or future performance of any strategy discussed on this website.