A trading strategy can win 70%, 80%, or even 90% of its trades and still lose money. The reason is simple: win rate measures how often you are right, but it does not measure how much you make when you are right or how much you lose when you are wrong.
This is one of the most common mistakes traders make when evaluating a forex, gold, index or prop-firm strategy. A high win rate looks impressive in a backtest, but profitability depends on the relationship between average wins, average losses, position sizing, trading costs, drawdown and market conditions.
For example, imagine a strategy that wins 9 out of 10 trades with a $10 profit on each winner but loses $120 on the one losing trade. The strategy has a 90% win rate, yet its 10-trade result is only $90 – $120 = -$30.
That is why traders should evaluate expectancy and risk-to-reward rather than treating win rate as the main measure of quality.
Why a High Win Rate Strategy Can Still Lose Money
The core issue is the size of your winners compared with your losers. A strategy does not need to win most trades to be profitable, and a strategy that wins most trades is not automatically profitable.
A useful simplified expectancy formula is:
Expectancy = (Win Rate × Average Win) − (Loss Rate × Average Loss)
Suppose a system wins 60% of trades, makes $100 on a winning trade and loses $80 on a losing trade:
(0.60 × $100) − (0.40 × $80) = $28 per trade
Now consider a 90% win-rate system that makes $10 on winners and loses $120 on losers:
(0.90 × $10) − (0.10 × $120) = -$3 per trade
The second strategy wins far more often, but its mathematical expectancy is negative.
Win Rate vs Risk-to-Reward Ratio
Win rate and risk-to-reward should always be analysed together. Risk-to-reward describes how much you are targeting relative to the amount you are willing to lose.
| Win Rate | Average Risk | Average Reward | Potential Result |
|---|---|---|---|
| 40% | 1R | 2R | Can be profitable |
| 50% | 1R | 1.5R | Can be profitable |
| 70% | 1R | 0.5R | Can still be weak |
| 90% | 1R | 0.1R | Can be unprofitable |
Here, R represents the amount you risk on one trade. The exact outcome depends on execution and costs, but the table shows why win rate cannot be evaluated in isolation.
The Small-Loss, Large-Loss Problem
Many high-win-rate strategies are built around taking frequent small profits while occasionally suffering a very large loss. This can happen with systems that use very wide stop losses, averaging down, grid trading, martingale-style position increases or trades that are allowed to run far beyond their original risk.
The equity curve may look smooth for weeks or months. Then one unusual market move can erase a large portion of previous gains.
A healthier approach is to define the maximum acceptable loss before entering the trade and size the position around that risk. A strategy should not need one exceptional winning trade to recover from a single oversized loss.
Expectancy Matters More Than Win Rate
Expectancy tells you what a strategy has historically produced per trade on average. It is not a guarantee of future performance, but it is much more informative than win rate alone.
Consider two systems:
- Strategy A: 80% winners, average win 0.4R, average loss 2R.
- Strategy B: 45% winners, average win 2R, average loss 1R.
Strategy A can look much better on a trading dashboard because it produces many winning trades. Strategy B may have a much stronger mathematical profile because its winners are significantly larger than its losses.
This is why professional strategy evaluation focuses on the complete distribution of returns rather than a single headline statistic.
Trading Costs Can Turn a Small Edge Into a Loss
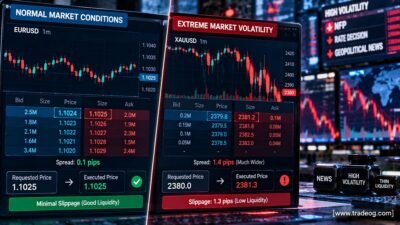
A backtest can also show a high win rate while ignoring the full cost of execution. In live forex trading, traders may pay or incur costs through spreads, commissions, swaps, slippage and differences between expected and executed prices.
This matters particularly for scalping strategies. If a system targets only a few points per trade, even a small spread or execution difference can consume a meaningful part of the expected profit.
For volatile markets such as gold, execution conditions can change quickly. A strategy that appears profitable before costs may become marginal or negative after realistic trading costs are included.
For more on execution, see Why Does Slippage Increase When Market Volatility Is Extremely High?
Why a High Win Rate Can Hide Large Drawdowns
Win rate also says very little about the path your account takes to reach its final return.
A strategy may have a high percentage of winning trades but still experience a severe drawdown because losing trades are disproportionately large. This is especially important for traders using prop firms, where daily loss limits and maximum drawdown rules can cause an otherwise profitable strategy to fail an evaluation.
Two strategies can have the same final return but completely different drawdown profiles. The one with lower and more controlled drawdown is generally easier to execute consistently.
Profit Factor Is Another Important Metric
Profit factor compares total gross profits with total gross losses:
Profit Factor = Gross Profit ÷ Gross Loss
A profit factor above 1 means the historical gross profits exceeded gross losses. But the number should be interpreted with the sample size, drawdown, trading costs and market conditions in mind.
For example, a strategy with a 90% win rate and a profit factor of 1.05 may be far less attractive than a strategy with a 55% win rate and a profit factor of 1.60, depending on drawdown and robustness.
Sample Size Can Make a High Win Rate Misleading
Another common mistake is judging a strategy after only a small number of trades.
A strategy that wins 18 of its first 20 trades has a 90% observed win rate. That sounds excellent, but 20 trades are not enough to establish that the underlying win probability is actually 90%.
As the number of trades increases, random variation becomes easier to identify. Traders should analyse a sufficiently large sample across different market conditions rather than selecting only the period where the strategy performed best.
If you are unsure how large your sample should be, see How Many Trades Are Needed Before You Can Judge a Trading Strategy?
Backtesting Can Make a Strategy Look Better Than It Really Is
A high historical win rate can sometimes be the result of overfitting. A trader may repeatedly change entry rules, indicators, stop-loss levels and take-profit settings until the strategy fits historical data exceptionally well.
The result can be a strategy that looks impressive on the backtest but performs poorly on unseen data.
This is why traders should use out-of-sample testing, walk-forward testing and realistic assumptions instead of relying on one optimised historical period.
Read more about this problem in How Can Traders Tell Whether a Strategy Is Overfitted to Historical Data?
Market Conditions Can Change the Win Rate
A strategy does not operate in a vacuum. Forex and gold markets move through trending, ranging, high-volatility and low-volatility environments.
A setup that performs extremely well during a stable range can struggle when the market begins trending strongly. Likewise, a breakout strategy may perform well during high-volatility sessions but produce many false signals during quiet periods.
Therefore, instead of asking only, “What is the win rate?”, ask:
- What market conditions produced the best results?
- What conditions produced the worst results?
- Does the strategy have a maximum drawdown limit?
- How does performance change after spreads and commissions?
- Does the strategy remain profitable outside the optimisation period?
- How many independent trades support the results?
Why Traders Become Obsessed With Win Rate
Win rate is easy to understand. Saying “my strategy wins 80% of trades” feels more convincing than discussing expectancy, variance, maximum drawdown and distribution of returns.
But trading is not a prediction contest. You do not need to be right on every trade. You need a repeatable process where the average outcome is favourable and the risk of ruin remains controlled.
A 45% win-rate strategy with disciplined risk management can be easier to survive than a 90% win-rate strategy that occasionally suffers catastrophic losses.
How Indian Forex and Gold Traders Should Evaluate a Strategy
For Indian traders, the evaluation should include the actual trading environment rather than just the strategy’s backtest results. Consider spreads, commissions, currency conversion, broker execution, overnight costs and the time at which your chosen market is most liquid.
If your account is funded in one currency while your personal expenses are in INR, changes in USD/INR can also affect your real-world return after converting profits. This is separate from the strategy’s trading expectancy, but it matters when evaluating the money you actually take home.
For a broader look at currency effects, read How Indian Traders Can Calculate Their Real Return After INR Depreciation.
A Better Checklist Than “What Is the Win Rate?”
Before trusting a trading strategy, review these numbers together:
- Win rate: How frequently does the system win?
- Average win: How much does a typical winning trade make?
- Average loss: How much does a typical losing trade cost?
- Expectancy: Is the average trade mathematically positive?
- Profit factor: How do gross profits compare with gross losses?
- Maximum drawdown: What is the worst historical decline?
- Number of trades: Is the sample large enough to be meaningful?
- Trading costs: Does the edge survive spreads, commissions and slippage?
- Market conditions: Does the system work across more than one environment?
- Out-of-sample performance: Does it work on data that was not used to build it?
What Is a Good Win Rate for a Trading Strategy?
There is no universal “good” win rate. A 35% win rate can be profitable if winners are substantially larger than losses. A 75% win rate can be dangerous if occasional losses are several times larger than average wins.
The better question is whether the strategy has positive expectancy after realistic costs and whether its drawdown is acceptable for your account and risk limits.
Final Takeaway
A high win rate does not equal a profitable trading strategy. Profitability comes from the interaction between win rate, average win, average loss, position sizing, expectancy, drawdown and execution costs.
Do not choose a strategy simply because it shows an impressive percentage of winning trades. Look at the complete risk profile and test whether the edge survives different market conditions and realistic execution.
The goal is not to win every trade. The goal is to build a process where losses are controlled, winners are meaningful, and the long-term mathematical expectancy remains positive.
Frequently Asked Questions
Can a 90% win rate strategy lose money?
Yes. If the average losing trade is much larger than the average winning trade, a strategy can lose money despite winning 90% of trades.
Is a 50% win rate profitable?
It can be. If the average winning trade is larger than the average losing trade and trading costs are controlled, a 50% win rate can produce positive expectancy.
What is more important, win rate or risk-to-reward?
Neither should be viewed alone. The combination of win rate, average win and average loss determines expectancy. Risk-to-reward is useful because it shows how much you stand to gain relative to what you risk.
Why do high win rate strategies often have large drawdowns?
Some systems generate many small wins while allowing occasional losses to become very large. That structure can create a high win rate but still produce severe drawdowns.
Should I trust a strategy with a 90% backtest win rate?
Not based on win rate alone. Check the number of trades, profit factor, expectancy, maximum drawdown, trading costs and out-of-sample results before drawing conclusions.