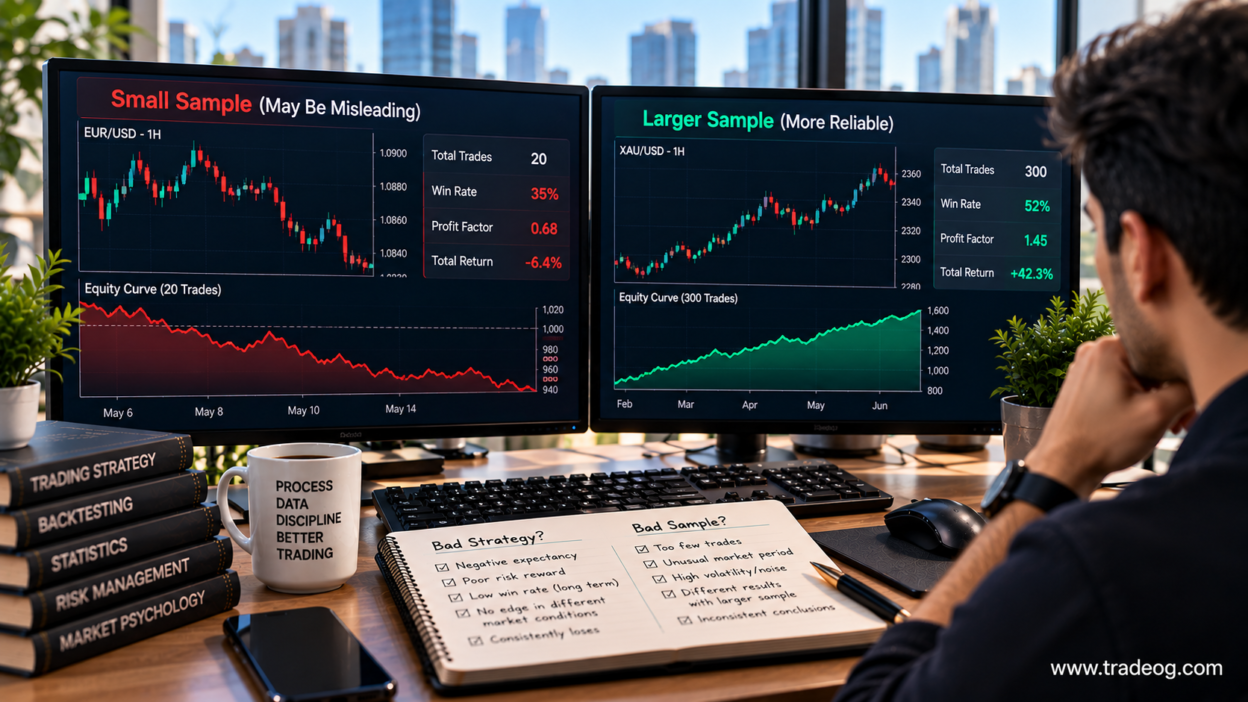
A trading strategy can look terrible for two very different reasons: the strategy may genuinely have no edge, or the sample used to judge it may simply be too small, unusual or unrepresentative.
This distinction matters because traders often make a decision after a handful of losses. A strategy loses 8 of its first 15 trades, and the trader concludes that the setup is broken. Another strategy wins 9 of 12 trades, and the trader assumes it has discovered a highly profitable edge. Both conclusions can be premature.
A backtest is an observation of a strategy under a particular sample of market conditions. It is not automatically proof that the strategy will behave the same way in the future. Research on backtesting has also highlighted the risks of data mining, multiple testing, overfitting and out-of-sample failure. CME Group backtesting research
What Is a Bad Trading Strategy?
A bad trading strategy is one whose underlying rules do not produce a sufficiently positive expectancy after realistic trading costs and risk.
That does not mean the strategy must win every month. A valid strategy can experience losing streaks, drawdowns and periods of weak performance. The important question is whether its long-run behaviour remains consistent with a genuine edge.
Warning signs include:
- negative expectancy across sufficiently large and varied samples
- performance disappearing after realistic spreads, commissions and slippage
- poor results across different market regimes
- large dependence on one unusually profitable period
- constant rule changes required to keep the backtest profitable
- performance collapsing on unseen data
- an edge that exists only under one exact parameter combination
What Is a Bad Trading Sample?
A bad sample is not necessarily a sample containing losing trades. It is a dataset that is too small, biased or unrepresentative to support the conclusion being made from it.
Examples include:
- testing a strategy over only 15 or 20 trades
- testing only one market regime
- testing only one currency pair
- testing only unusually volatile weeks
- testing only trending conditions
- excluding losing periods because they “look abnormal”
- evaluating a strategy immediately after changing its rules
A strategy can therefore be sound while a particular sample produces a poor result.
Why a Small Number of Trades Can Mislead You
Suppose a strategy has a genuine 50% win probability over a long sequence of independent opportunities. That does not mean every group of 20 trades will contain exactly 10 winners.
You can easily get clusters such as:
- 6 winners and 14 losers
- 8 winners and 12 losers
- 13 winners and 7 losers
- 15 winners and 5 losers
The observed result from a small sample can therefore differ substantially from the underlying probability.
This is why “my strategy lost 10 trades in a row” is not enough information to prove that the strategy is broken. The correct response is to examine the probability of such a sequence, the strategy’s historical distribution of losing streaks, the market regime and the complete sample.
Do Not Judge a Strategy by Win Rate Alone
Win rate is one of the easiest statistics to understand and one of the easiest to misuse.
Consider two strategies:
| Metric | Strategy A | Strategy B |
|---|---|---|
| Win rate | 70% | 42% |
| Average win | 0.7R | 2.2R |
| Average loss | 2R | 1R |
| Approx. expectancy | -0.11R | +0.34R |
Strategy A wins far more often but can still lose money because its average losing trade is much larger than its average winner.
Strategy B loses more frequently but can have positive expectancy because its winners are substantially larger.
When separating a bad strategy from a bad sample, start with expectancy and distribution of returns rather than win rate alone.
Use Expectancy to Ask the Right Question
A simple expectancy framework is:
Expectancy = (Win rate × Average win) − (Loss rate × Average loss)
For example, if a strategy wins 45% of trades, averages +2R on winners and loses 1R on losers:
Expectancy = (0.45 × 2R) − (0.55 × 1R) = +0.35R
A short sample might still produce a negative result even when the long-run expectancy is positive.
That is the core reason a trader should separate the question “Did this sample lose?” from “Does the strategy have a positive expected value?”
Look at the Distribution, Not Just the Total Profit
A backtest showing +30R is not enough by itself.
Ask how that +30R was produced.
Did the strategy make:
- +1R, +1R, -1R repeatedly?
- one huge +25R period followed by losses?
- steady gains across different years?
- most of its money during one news event?
- profits from only one currency pair?
A strategy whose results are broadly distributed across many independent or meaningfully different observations is generally more informative than one whose entire result depends on a tiny number of outliers.
Check the Number of Trades
There is no universal magic number of trades that proves a strategy works. The appropriate sample depends on the strategy, market, frequency and statistical properties of its returns.
However, 10 or 20 trades should generally be treated as an early observation rather than a definitive verdict.
For a strategy producing only a few trades per month, collecting enough observations may take a long time. A high-frequency strategy can collect thousands of observations quickly, but those observations may be correlated and therefore provide less independent information than the raw trade count suggests.
This distinction is important: 1,000 trades do not automatically equal 1,000 independent pieces of evidence.
Market Regime Can Create a Bad Sample
A strategy can be designed for one type of market environment and temporarily perform poorly when the environment changes.
For example:
| Regime | Possible Strategy Behaviour |
|---|---|
| Strong trend | Trend-following strategy may perform well |
| Range-bound market | Trend-following strategy may suffer repeated false breaks |
| High volatility | Breakout strategy may perform strongly or experience large whipsaws |
| Low volatility | Breakout signals may fail more frequently |
| News-heavy period | Execution costs and slippage can change the outcome |
If your entire test contains only one regime, you may be measuring the environment rather than the robustness of the strategy.
Separate Strategy Logic From Market Conditions
When a strategy loses, ask two separate questions:
- Did the rules execute correctly?
- Was the market environment suitable for those rules?
If the rules were followed exactly and the setup repeatedly failed in a particular regime, that may be a strategy weakness, a regime mismatch or simply normal variance.
If the trader changed entries, exits or stop placement after each loss, the resulting sample becomes much harder to interpret because the strategy itself is moving.
Do Not Change the Rules After Every Losing Streak
This is one of the biggest ways traders accidentally create an overfit strategy.
Imagine the original strategy loses five trades. The trader changes the moving-average setting. It then loses again, so the trader adds a volatility filter. After another losing streak, a session filter is added.
Eventually the backtest looks excellent.
But the trader may not have discovered a better strategy. They may have optimized the rules specifically for the historical sample.
Research on backtesting warns that repeated testing and data mining can make apparently strong historical results less reliable. CME Group backtesting research
Use In-Sample and Out-of-Sample Testing
A better process is to separate the data.
In-sample data can be used to develop the strategy.
Out-of-sample data should be reserved for evaluating whether the rules continue to work on data that was not used to create them.
For example:
| Period | Purpose |
|---|---|
| 2021–2023 | Strategy development |
| 2024 | Parameter validation |
| 2025–2026 | Out-of-sample evaluation |
The exact dates are only an example. The important concept is that the final evaluation should not repeatedly feed information back into strategy design.
Walk-Forward Testing Is Even More Useful
Markets change. A single static train/test split can still leave questions unanswered.
Walk-forward testing repeatedly develops or calibrates a strategy on one historical window and then evaluates it on the next unseen window.
This helps answer a more realistic question:
Does the strategy continue to work when applied to data it did not use to make its previous decisions?
If performance repeatedly collapses immediately outside the development window, the strategy may be overfit.
Compare the Strategy With a Simple Benchmark
Sometimes a complicated strategy looks impressive simply because the market itself was favourable.
Compare it with a basic benchmark.
For a trend-following strategy, you might compare against a simple trend rule. For a breakout system, compare it with a basic breakout. For an intraday strategy, compare its results with a simple session-based benchmark.
If the complex strategy barely improves on a simple benchmark after costs and risk are considered, its complexity may not be providing much additional edge.
Check Whether Costs Destroy the Apparent Edge
A strategy can look profitable before costs and unprofitable after costs.
Include realistic assumptions for:
- spread
- commission
- slippage
- swap or financing where applicable
- spread expansion during volatile periods
- execution delays
This is especially important for scalping strategies, where a small gross edge can disappear after trading friction.
TradeOG has covered related execution issues in Spread Expansion vs Slippage: What’s Actually Happening? and How Broker Server Latency Can Affect Short-Term Trading.
Examine Losing Streaks Before Calling the Strategy Broken
Every strategy has a distribution of losing streaks.
A trader who has never experienced eight consecutive losses may assume that eight losses prove the strategy is broken. But if the strategy’s historical distribution occasionally produces eight-loss sequences, the current result may simply be normal variance.
The better approach is to ask:
- How often has this losing streak occurred historically?
- Is it unusually long relative to the strategy’s previous history?
- Did market conditions change?
- Did execution costs increase?
- Were the rules followed consistently?
- Has the strategy also failed in other independent samples?
Use Multiple Independent Periods
A powerful test is to divide your history into separate periods instead of treating the entire dataset as one block.
| Sample | Question |
|---|---|
| Period 1 | Did the strategy work during the first market environment? |
| Period 2 | Did performance persist after conditions changed? |
| Period 3 | Did the edge survive another independent period? |
| Out-of-sample | Did the rules work on unseen data? |
| Forward test | Does live or paper performance resemble expectations? |
A strategy that produces a similar type of edge across several periods is more convincing than one that produces nearly all its profits in one historical segment.
Do Not Confuse Statistical Noise With Strategy Failure
Backtesting itself contains uncertainty. A result is an estimate of the strategy’s behaviour, not a guarantee.
The Basel Committee’s backtesting framework makes an important general point: test outcomes can fall into an intermediate zone where the evidence is not sufficient to conclude confidently that a model is either accurate or inaccurate. BIS backtesting framework
The broader lesson for traders is useful: avoid treating every positive or negative sample as definitive evidence.
What a Strong Strategy Evaluation Should Contain
Instead of recording only net profit and win rate, build a complete evaluation sheet containing:
- number of trades
- average win
- average loss
- expectancy
- profit factor
- maximum drawdown
- maximum losing streak
- average trade duration
- gross profit
- gross loss
- spread and commission assumptions
- slippage assumptions
- performance by market regime
- performance by session
- performance by instrument
- in-sample performance
- out-of-sample performance
- forward-test performance
A Simple Diagnostic Framework
When a strategy performs badly, work through this sequence.
- Verify the sample. Is there enough data to make the conclusion meaningful?
- Verify execution. Were the rules followed exactly?
- Verify costs. Are spread, commission and slippage realistic?
- Check expectancy. Does the strategy have positive expected value?
- Check regimes. Did the losses cluster in a particular market environment?
- Check independent periods. Does the result repeat across different samples?
- Check out-of-sample results. Does the edge survive unseen data?
- Check robustness. Does a small parameter change completely destroy performance?
- Check benchmarks. Is the strategy genuinely better than a simpler approach?
- Only then change the rules.
Signs You Probably Have a Bad Sample
- The sample contains very few trades.
- Almost all trades occurred in one market regime.
- A few unusual trades dominate the total result.
- The strategy has historically experienced similar losing streaks.
- A larger independent sample produces substantially different results.
- Out-of-sample performance is reasonable.
- The strategy’s underlying expectancy remains positive.
Signs You May Actually Have a Bad Strategy
- Negative expectancy persists across large and varied samples.
- Performance disappears after realistic costs.
- The strategy fails across multiple independent periods.
- Out-of-sample performance consistently collapses.
- Small parameter changes destroy the entire edge.
- The strategy relies on a tiny number of exceptional trades.
- It requires repeated historical tweaking to remain profitable.
- Its advantage disappears when compared with a simple benchmark.
How Indian Traders Can Apply This to Forex and XAU/USD
Indian traders often evaluate strategies on XAU/USD, EUR/USD or other instruments using relatively short backtests. The temptation is to judge the strategy after a few weeks because the chart contains many candles.
But a large number of candles does not necessarily mean a large number of independent trade opportunities.
A five-minute gold strategy that produces 20 signals during a single high-volatility week may be heavily influenced by one market environment. A longer test covering quiet periods, trend periods, range conditions and major-news sessions can provide a much better picture.
For prop-firm traders, this distinction becomes even more important because a strategy can be profitable over a long horizon while still producing a drawdown that violates a firm’s daily or maximum loss rule.
Therefore, evaluate both strategy expectancy and account-level risk behaviour.
Frequently Asked Questions
How many trades do I need to know if a strategy works?
There is no universal number. The required sample depends on the strategy and the variability of its returns. A small number of trades should generally be treated as preliminary evidence rather than a final verdict.
Can a profitable strategy have 10 losing trades in a row?
Yes. A positive-expectancy strategy can experience long losing streaks. Whether the streak is abnormal depends on the strategy’s historical distribution and assumptions.
Is a 70% win-rate strategy automatically better?
No. Win rate must be evaluated alongside average win, average loss, expectancy, drawdown and trading costs.
What is the biggest sign of an overfit strategy?
A common warning sign is excellent historical performance that collapses on unseen data or requires repeated parameter changes to maintain profitability.
Should I stop a strategy after a losing month?
Not automatically. First determine whether the losing month falls within the strategy’s historically expected variance and whether the rules and market conditions were consistent with the test assumptions.
Final Takeaway
The most important question after a losing trading period is not simply, “Is my strategy bad?”
Ask a more precise question: “Does this sample provide enough evidence to conclude that the strategy’s underlying edge has failed?”
A small or unusual sample can make a good strategy look terrible. A lucky sample can make a bad strategy look exceptional. The solution is not to chase a better-looking backtest. It is to increase the quality of the evidence.
Use larger and more varied samples, separate development from out-of-sample testing, include realistic execution costs, measure expectancy, study drawdowns and losing streaks, and test whether the strategy survives different market regimes.
Only after those checks should you decide whether the problem is the strategy or simply the sample used to judge it.