

Quick answer: A retail broker’s price feed is usually not created from one universal global forex price. In an OTC market such as spot FX, a broker can receive bid and ask quotes from multiple liquidity providers, banks, non-bank market makers or electronic venues, then use pricing and aggregation technology to construct the stream shown on a client’s platform. The final quote can be affected by liquidity-provider selection, aggregation rules, spreads, markups, risk controls, internalisation and the broker’s execution model.
This is why two brokers can show slightly different XAU/USD or EUR/USD prices at the same moment without either necessarily displaying an incorrect market price. The FX market is fragmented across venues and liquidity providers rather than operating through one central order book. BIS research describes this fragmented structure and the role of liquidity aggregators in connecting multiple liquidity pools. citeturn0search13turn0search14
What Is a Broker Price Feed?
A broker price feed is the stream of market prices that a trading platform receives from the broker’s pricing infrastructure.
For a typical FX or CFD instrument, the most important components are:
- Bid: the price at which the broker is willing to buy or quote the sell side.
- Ask: the price at which the broker is willing to sell or quote the buy side.
- Spread: the difference between bid and ask.
- Timestamp: when the quote was generated or received.
- Liquidity: the available trading interest behind the displayed prices.
The price shown on MT4, MT5, cTrader or another platform is therefore the end result of a technology and execution chain. It is not necessarily a direct copy of one bank’s screen.
There Is No Single Global Forex Price
This is the first concept traders need to understand.
Spot FX is an over-the-counter market. Unlike an exchange-traded futures contract with one central matching engine, FX trading is distributed across banks, electronic communication venues, dealer platforms, non-bank liquidity providers and other trading venues.
BIS research describes the spot FX market as highly fragmented, with primary venues such as EBS and Reuters Matching alongside numerous dealer-customer venues and single-dealer platforms. It also notes that liquidity aggregators help participants connect to multiple venues and providers. citeturn0search14
That means there can be several valid EUR/USD, GBP/USD or XAU/USD quotes at almost exactly the same time.
Small differences are normal.
Where Does the Broker Get Its Prices?
A broker may connect to several sources rather than relying on one provider.
Depending on its business model and instrument, the pricing network can include:
- Global banks
- Non-bank liquidity providers
- Electronic trading venues
- Prime brokers
- Prime-of-prime providers
- Market makers
- Exchange-derived prices
- Internalised client flow
Institutional FX platforms demonstrate how this works at a larger scale. CME’s EBS Direct, for example, allows liquidity consumers to access a range of bank and non-bank liquidity providers and create tailored liquidity pools of executable streaming prices or request-for-stream pricing. citeturn0search7
A retail broker can then use its own connectivity and pricing technology to turn multiple incoming sources into a client-facing quote.
The Basic Broker Price-Feed Pipeline
A simplified version looks like this:
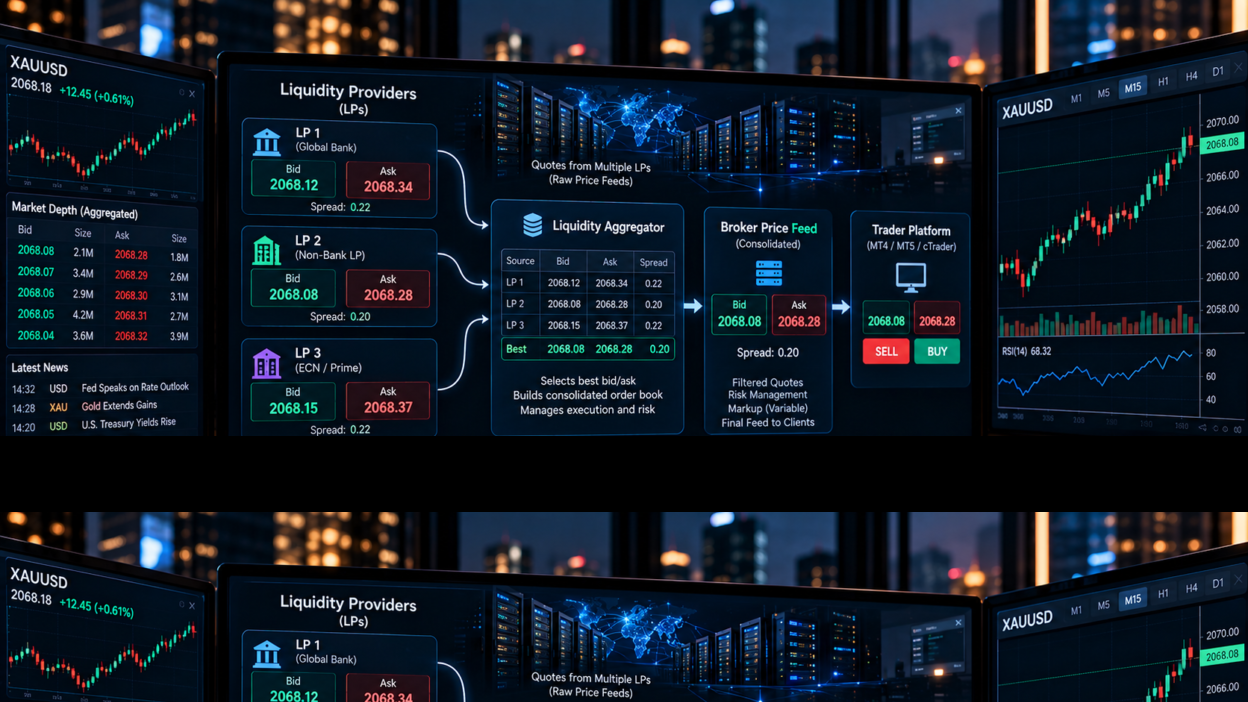
Liquidity Providers → Connectivity → Liquidity Aggregator → Pricing/Risk Engine → Broker Feed → MT4/MT5/cTrader → Trader
Each stage can affect what eventually appears on your chart.
1. Liquidity Providers Send Quotes
Imagine a broker receives these hypothetical XAU/USD quotes:
| Provider | Bid | Ask | Spread |
|---|---|---|---|
| LP A | 2068.12 | 2068.34 | 0.22 |
| LP B | 2068.08 | 2068.28 | 0.20 |
| LP C | 2068.15 | 2068.37 | 0.22 |
The broker now has several competing prices.
It does not necessarily have to show one provider’s entire quote. Its aggregation system can compare the available bids and asks and construct a better combined market view.
This is the basic reason liquidity aggregation exists.
2. The Liquidity Aggregator Compares Quotes
A liquidity aggregator is technology that receives prices from multiple liquidity sources and manages them as a combined pool.
BIS describes liquidity aggregation as a way of consolidating access to multiple trading venues and providers. This can reduce the cost and complexity of searching across a fragmented market. citeturn0search13turn0search15
In the simplified example above, the best available bid is 2068.15 from LP C, while the best available ask is 2068.28 from LP B.
The aggregator can therefore identify a potential top-of-book combination of:
Bid 2068.15 / Ask 2068.28
Real institutional aggregation is more complicated than simply choosing the highest bid and lowest ask. Size, credit limits, provider quality, latency, liquidity conditions, execution rules and broker-specific configuration can all matter.
3. The Broker Applies Its Pricing Logic
The broker may then apply its own pricing logic.
This can include:
- Spread markup
- Minimum spread rules
- Price smoothing or filtering
- Stale-quote protection
- Liquidity-provider selection
- Instrument-specific pricing rules
- Client segmentation
- Risk controls
- Session or market-condition adjustments
This is one reason the price you see is not necessarily identical to the raw price received from a liquidity provider.
4. The Final Feed Goes to the Trading Platform
After the broker’s pricing infrastructure produces a client-facing quote, that feed is distributed to the trading platform.
The platform then displays the price as candles, ticks, market-watch quotes and order-entry prices.
For example:
Raw LP quotes → aggregation → broker pricing → platform quote → candle formation
This distinction is important when comparing broker charts.
Why Two Brokers Can Show Different XAU/USD Prices
Suppose Broker A receives liquidity from Providers 1, 2 and 3 while Broker B uses Providers 4, 5 and 6.
At 10:15:03, the providers may not quote exactly the same price.
Broker A could display:
2068.20 / 2068.42
while Broker B displays:
2068.24 / 2068.46
Both can be legitimate market quotes.
The difference can come from:
- Different liquidity providers
- Different aggregation pools
- Different markup policies
- Different quote-update speeds
- Different filtering
- Different execution models
- Temporary liquidity imbalance
TradeOG’s article Why Your MT5 Chart Price Can Differ From Another Broker explores this issue from the trader’s perspective.
Bid and Ask Matter More Than the Candle You See
One of the biggest mistakes retail traders make is treating the displayed candle as if it represents a single executable price.
It does not.
A market quote has at least two sides:
Bid ≠ Ask
For a long position, execution is generally associated with the ask when entering and the bid when closing. For a short position, the relationship is reversed.
CME Group specifically notes that in retail FX/CFD environments, traders are executed against the broker’s displayed bid/ask prices rather than a single centralised global order book. citeturn0search0
This explains why a chart can appear not to have touched a level while an order still triggers, depending on which side of the quote is relevant to the order.
How a Price Feed Becomes a Candle
Another important distinction is between the raw tick stream and the chart.
A 1-minute candle is constructed from price updates during that minute.
Depending on the platform and instrument, the chart may represent a particular side of the quote or use broker-specific price construction.
For example, if the feed produces many bid updates during one minute, the resulting candle can have:
- Open
- High
- Low
- Close
The candle therefore represents the broker’s price stream over that interval. It is not a universal candle generated from every transaction occurring in the global market.
This is why the same XAU/USD candle can look slightly different between brokers.
What Happens When a Liquidity Provider Stops Quoting?
Liquidity providers do not necessarily provide identical prices or identical liquidity at all times.
During major news, extreme volatility or abnormal market conditions, some liquidity can become less available or more expensive.
A broker’s aggregator may then:
- Switch to another provider
- Reduce available execution size
- Show a wider spread
- Change the ranking of providers
- Reject or re-route certain executions
- Use internal liquidity where appropriate
This can cause the broker’s quote to behave differently from the quote a trader was seeing a few seconds earlier.
TradeOG’s article Why Forex Quotes Can Become Less Accurate During Extreme Volatility covers how fragmented markets and rapidly changing quotes can affect price consistency.
Why Spreads Expand
Spreads are not fixed characteristics of the underlying currency pair.
A liquidity provider’s spread can change with:
- Volatility
- Order-flow imbalance
- Available liquidity
- Market risk
- News
- Time of day
- Positioning
When several providers simultaneously widen their quotes, the broker’s aggregate spread can widen as well.
This is especially relevant to XAU/USD because gold can experience rapid repricing around major macroeconomic events.
TradeOG’s Spread Expansion vs Slippage guide explains why wider spreads and execution slippage are related but different concepts.
Aggregation Does Not Mean the Broker Always Shows the “Global Best Price”
This is a critical distinction.
A broker’s aggregator usually sees only the liquidity sources to which that broker is connected.
It does not automatically see every quote from every bank, venue and trading participant in the world.
Therefore, “best available price” normally means:
Best price available within the broker’s accessible liquidity pool under its pricing and execution rules.
That is very different from claiming that the broker has discovered the one true global FX price.
A-Book, B-Book and Internalisation
The broker’s execution model can also change what happens after you click Buy or Sell.
In a simplified A-book model, client trades can be passed to external liquidity providers or hedged externally.
In a B-book model, the broker may internalise client exposure and become the counterparty.
Many real businesses use hybrid approaches rather than fitting perfectly into one label.
CME Group’s 2026 discussion of retail FX/CFD mechanics similarly distinguishes between market-maker models that internalise client orders and aggregator models that stream prices from multiple liquidity providers while managing client execution. citeturn0search0
The important point for traders is that the price feed and the execution model are related but not identical concepts.
What Is Last Look?
In some institutional FX workflows, a liquidity provider can use a mechanism commonly known as “last look,” where an incoming trade request is evaluated before final acceptance.
This can be used to manage latency and adverse-selection risk, but it can also introduce execution uncertainty.
CME’s discussion of retail FX/CFD mechanics notes that many such brokers operate with last-look arrangements through their liquidity providers. citeturn0search0
For traders, this means that receiving a streamed price and getting a completed execution are related events, but they are not necessarily the same event.
Why Latency Matters
Imagine a liquidity provider sends:
2068.20 / 2068.40
The broker receives it, processes it and distributes it to your platform.
During that short interval, the underlying market may already have moved.
Electronic FX markets operate at very high speeds. BIS research on modern FX infrastructure describes real-time aggregation and processing of venue data because market conditions can change in fractions of a second. citeturn0search12
The longer or more complex the path between source and trader, the more important latency becomes during fast markets.
Why XAU/USD Traders Should Care
This topic is particularly important for gold traders because XAU/USD is often traded with relatively tight intraday targets and stop losses.
A difference of a few tenths of a dollar can matter when:
- Scalping
- Trading around news
- Using tight stop losses
- Comparing brokers
- Trading prop-firm accounts
- Backtesting short-term strategies
For example, if Broker A’s ask is $0.30 higher than Broker B’s ask during a fast market, the entry price and chart behaviour can look meaningfully different to a short-term trader.
Why Your Stop Can Trigger on One Broker but Not Another
Suppose your long XAU/USD position has a stop at 2060.00.
Broker A’s relevant bid briefly touches 2059.98.
Broker B’s bid bottoms at 2060.05.
Your stop could trigger at Broker A but remain untouched at Broker B.
This does not automatically prove that Broker A manipulated the price.
The two brokers may have received different liquidity streams, different bid prices or different tick sequences.
TradeOG’s article Why XAU/USD Can Hit Your Stop Loss Without Breaking the Candle Low explains this problem in greater detail.
How Traders Can Compare Broker Feeds Properly
If you want to compare two brokers, do not compare only the candle screenshot.
Compare:
- Bid prices
- Ask prices
- Average spread
- Spread during news
- Tick frequency
- High and low values
- Execution price
- Slippage
- Execution speed
- Trading-session behaviour
For XAU/USD, also compare the same symbol specification. One broker’s XAUUSD can have different contract specifications, trading hours, decimal precision or price conventions from another.
What a Retail Trader Usually Cannot See
Your MT5 screen normally does not tell you the complete internal pricing architecture behind every tick.
You may not know:
- Which LP generated a particular quote
- Which LP won the aggregator’s routing decision
- How much liquidity existed behind every displayed level
- Which quotes were filtered
- Which prices were rejected as stale
- How the broker internally managed the position
That is why a trader should be careful with claims such as “my broker moved the market against me” based only on one chart difference.
Sometimes there is a genuine execution or pricing problem. But a difference between two OTC feeds is not, by itself, proof of wrongdoing.
Simple Example: From Bank Quote to Your Screen
Imagine the following chain:
Bank A: 2068.10 / 2068.30
Bank B: 2068.12 / 2068.32
Non-bank LP: 2068.08 / 2068.28
The aggregator evaluates the available quotes.
The broker’s pricing engine then decides what client-facing price to publish according to its configuration, risk controls and commercial model.
The client platform might finally display:
2068.10 / 2068.30
The trader sees only the final quote.
The infrastructure underneath may have involved multiple connections, algorithms and risk decisions in milliseconds.
Broker Feed vs Exchange Price Feed
Do not confuse an OTC broker feed with a centralized exchange feed.
On a central limit order book, participants can interact within a defined matching system. CME describes its FX CLOB markets as centralized, anonymous venues where participants interact through firm prices and price-time matching. citeturn0search10
Retail OTC FX/CFD pricing works differently. CME explicitly notes that there is no centralized order book aggregating all retail FX/CFD buying and selling interest. citeturn0search0
Both systems can produce highly useful prices, but the market structure is different.
How This Changes Your Trading Decisions
Understanding broker price feeds should change your expectations, not make you distrust every broker.
Use these principles:
- Do not expect every broker to print identical candles.
- Do not compare only the mid-price.
- Watch bid and ask when analysing stops and entries.
- Expect spreads to change during volatile conditions.
- Compare execution quality rather than screenshots alone.
- Understand your broker’s execution model.
- Use the same broker feed for backtesting and live execution whenever possible.
Final Takeaway
A broker price feed is the visible output of a much larger market-data and execution system.
Liquidity providers → multiple quotes → aggregation → pricing/risk logic → broker feed → trading platform.
Because the underlying FX market is fragmented, there is no requirement for every broker to display exactly the same price at every millisecond. Different liquidity pools, providers, spreads, latency, filtering and execution models can produce small or temporary differences.
For XAU/USD traders, understanding this architecture helps explain why broker highs and lows can differ, why spreads can expand, why stops can trigger on one feed but not another, and why the price on your MT5 screen should not automatically be treated as a universal global gold price.
The better question is not simply “Which broker has the correct price?”
It is:
“How is this broker sourcing, aggregating, pricing and executing the quote I am actually trading?”
FAQs
Where does a forex broker get its price?
A broker can source prices from banks, non-bank liquidity providers, electronic venues, prime or prime-of-prime relationships and other liquidity sources. The exact structure depends on the broker.
Do all brokers use the same liquidity providers?
No. Brokers can have different liquidity relationships and aggregation pools, which is one reason their bid and ask prices can differ.
Why do two brokers show different XAU/USD prices?
They may use different liquidity providers, pricing rules, spreads, filtering, update frequencies or execution models. In an OTC market, small price differences are normal.
Does a broker create the XAU/USD price?
Not necessarily. A broker can aggregate external liquidity, internalise client flow, or use a hybrid model. Its displayed price is the broker’s client-facing quote rather than a universal global price.
Can broker price feeds affect stop losses?
Yes. Stop execution depends on the relevant bid or ask and the broker’s actual price feed. Two brokers can therefore trigger a stop at slightly different moments.
What is a liquidity aggregator?
A liquidity aggregator is technology that combines price streams from multiple liquidity sources and helps a broker manage available quotes and execution. In fragmented FX markets, aggregation helps connect participants to multiple liquidity pools.
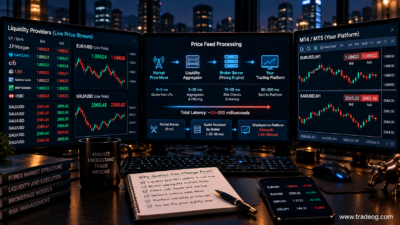

[…] article How Broker Price Feeds Are Built From Liquidity Providers explains how liquidity-provider quotes can pass through aggregation and broker pricing before […]
[…] TradeOG has covered this issue in Why Two Brokers Can Show Different Forex Highs and Lows and How Broker Price Feeds Are Built From Liquidity Providers. […]