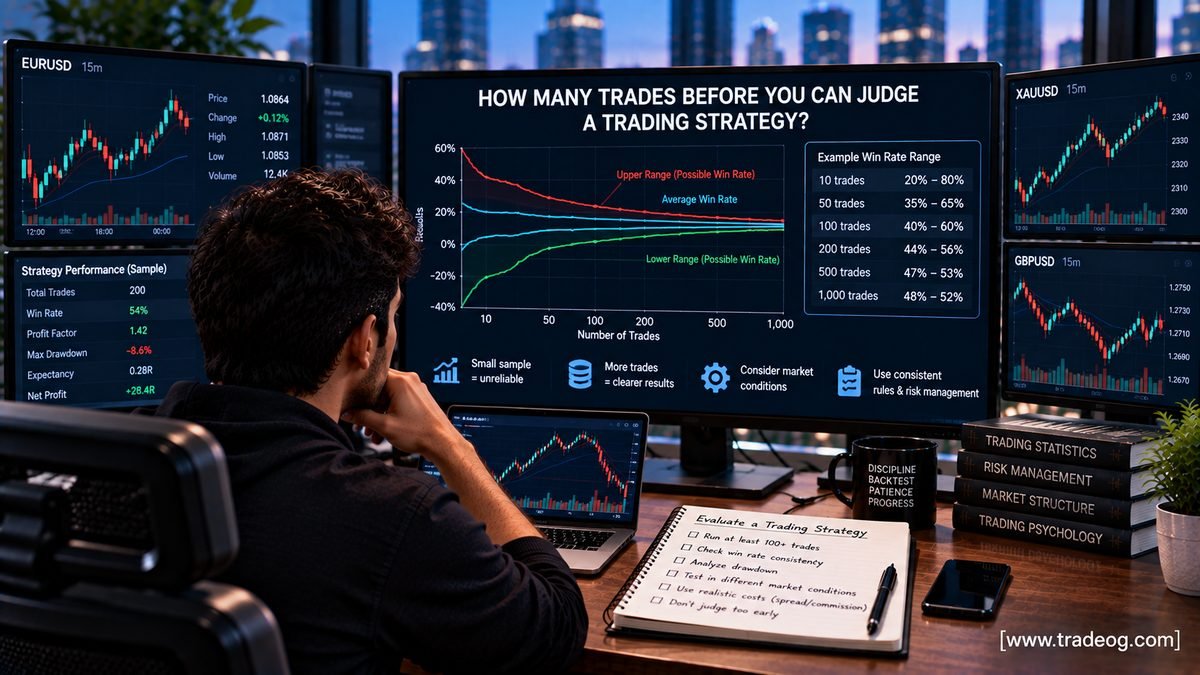
There is no magic number of trades that can prove a trading strategy works. A short winning streak can be caused by normal randomness, while a larger sample can reveal whether the underlying edge is actually consistent.
For practical strategy evaluation, treat the first 20–50 trades as a diagnostic period, around 100 trades as a useful initial review point, and 200–300+ trades as a stronger evidence base when those trades cover different market conditions. These are practical guidelines, not universal statistical thresholds.
Why Trade Count Matters
Every trade contains randomness. One winner does not prove that a setup works, and one loss does not prove that it fails. A small sample can be dominated by one unusually large winner, one large loss, a temporary trend or a short losing streak.
Is 30 Trades Enough?
Thirty trades can reveal obvious problems with execution, risk management or rule-following, but it is normally too small to confidently declare a strategy profitable. If 21 of 30 trades win, the observed win rate is 70%, but that does not mean the strategy has a sustainable 70% win rate.
What About 100 Trades?
One hundred trades gives you a much better initial picture. Review win rate, average win, average loss, expectancy, profit factor, maximum drawdown, losing streaks, risk per trade, slippage, commissions and performance across different market conditions.
However, 100 trades from one unusually strong trend are not equivalent to 100 trades spread across trends, ranges, high volatility and quiet conditions.
Why 200–300 Trades Can Be More Informative
A sample of 200–300 trades can provide stronger evidence for many short- and medium-term strategies, particularly when the trades span multiple market regimes. A strategy trading once a week needs a different evaluation horizon from a scalping system producing several setups per day.
The key point is that trade count and market exposure are different things. A large number of trades from one narrow regime may tell you less than a smaller, well-distributed sample.
Trade Count vs Time in the Market
| Factor | Why it matters |
|---|---|
| Number of trades | Reduces the influence of individual outcomes |
| Testing period | Shows whether performance survives changing conditions |
| Market regimes | Tests trends, ranges, volatility and reversals |
| Sessions | Shows whether results depend on a particular trading window |
| Trading costs | Tests whether the gross edge survives real execution |
Do Not Judge a Strategy by Win Rate Alone
A useful simplified expectancy formula is:
Expectancy = (Win Rate × Average Win) − (Loss Rate × Average Loss)
For example, a strategy winning 70% of trades but averaging 1R on winners and 3R on losers has approximately -0.20R expectancy before costs. Another strategy winning 45% but averaging 2R on winners and 1R on losers has approximately +0.35R expectancy. The second strategy has the lower win rate but the stronger expected result.
Why Losing Streaks Matter
A longer sample helps reveal normal losing streaks and drawdown. Record maximum consecutive losses, largest single loss, maximum peak-to-trough drawdown and recovery time. This is especially important when trading under strict daily or maximum loss limits.
Market Regimes Matter More Than a Bigger Number
Evaluate a strategy during strong bullish trends, bearish trends, ranges, high-volatility sessions, low-volatility periods, major news and ordinary sessions. A strategy does not have to work equally well everywhere, but you need to understand where its edge exists and where it breaks down.
Backtesting Does Not Automatically Make a Strategy Reliable
A backtest can contain thousands of trades and still be misleading if the rules were repeatedly optimised against historical data. Backtesting is useful for evaluating historical behaviour, but robust testing also considers realistic assumptions, out-of-sample performance, sensitivity and possible biases.
Data mining and multiple testing can make an apparently strong historical result look more convincing than it really is. Therefore, a huge trade count is not a substitute for a sound testing process.
Use In-Sample and Out-of-Sample Testing
- Develop the strategy using historical data.
- Freeze the rules.
- Test the unchanged rules on unseen data.
- Compare return, expectancy and drawdown.
- Forward-test the frozen rules before committing meaningful capital.
If performance collapses on unseen data, investigate overfitting, regime dependence and unrealistic historical assumptions.
How Many Trades for a Scalping Strategy?
Scalping systems generally need a large number of observations because they generate many trades and often have small expected edges. Evaluate several hundred trades while covering different sessions and volatility conditions. Spreads, commissions and slippage can materially change the result.
How Many Trades for a Swing Strategy?
Swing strategies generate fewer trades, so time matters as much as trade count. Fifty trades across two years may be more informative than fifty trades generated in two weeks. Include different market environments and major events where relevant.
How Many Trades Should You Track on XAU/USD?
Gold can change behaviour significantly across volatility regimes and macroeconomic events. A gold strategy should ideally be tested across London and New York sessions, quiet periods, strong trends, ranges, fast reversals and major US economic releases rather than only one favourable period.
Do Transaction Costs Change the Required Sample?
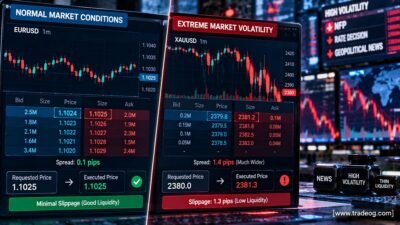
Yes. Include spread, commission, slippage, financing costs where applicable and realistic execution assumptions. A strategy with only a tiny gross edge may become unprofitable after costs.
A Practical Trade-Count Framework
| Sample | Practical use |
|---|---|
| 1–20 | Check execution and obvious flaws |
| 20–50 | Early diagnostic period |
| 50–100 | Begin reviewing expectancy and drawdown |
| 100–200 | More meaningful initial assessment |
| 200–300+ | Stronger evidence if market conditions are diverse |
| 300+ | Useful for deeper analysis, but never proof of future profitability |
What to Record for Every Trade
- Date and time
- Instrument
- Session
- Setup type
- Market regime
- Entry and exit
- Stop-loss and take-profit
- Risk in R
- Result in R
- Spread, commission and slippage
- Whether the rules were followed
- Execution or behavioural mistakes
This separates strategy performance from trader execution. A loss caused by breaking the rules should not automatically be treated as evidence that the strategy itself failed.
Do Not Keep Changing the Strategy During Testing
If you change the indicator, stop-loss, entry condition or trading session after every losing streak, your 150-trade spreadsheet may actually contain several different strategies. Freeze the rules during the evaluation period. If you make a meaningful change, create a new version and start a separate test.
When Should You Stop Testing?
Consider stopping or redesigning when expectancy remains negative after realistic costs, performance consistently fails across relevant regimes, out-of-sample results deteriorate sharply, drawdown is unacceptable, or the strategy requires constant rule changes to remain profitable.
Enough Trades vs Enough Evidence
You can have 500 trades and still have weak evidence if they came from one market regime, relied on unrealistic fills or were heavily optimised. The objective is not an arbitrary number; it is evidence that is sufficiently large, diverse, realistic and independent from the development process.
Final Checklist
- Is the sample large enough for the strategy?
- Does it cover multiple market regimes?
- Have you calculated expectancy?
- Have you measured maximum drawdown?
- Have you recorded losing streaks?
- Have you included trading costs?
- Have you separated in-sample and out-of-sample results?
- Have you frozen the rules?
- Does performance survive outside one favourable period?
- Have you forward-tested the strategy?
Frequently Asked Questions
Is 20 trades enough?
No. Twenty trades are useful for finding obvious problems but are normally too few for a confident profitability assessment.
Is 100 trades enough?
It is a useful milestone, but not a universal threshold. Check the conditions represented by those trades.
Is 300 trades enough to prove a strategy works?
No. Three hundred well-distributed trades provide stronger evidence but cannot guarantee future profitability.
Should I judge a strategy by win rate?
No. Combine win rate with average win, average loss, expectancy, profit factor, drawdown and costs.
Can a larger sample make a bad strategy profitable?
No. More data can improve your estimate of the underlying process; it does not manufacture a positive trading edge.
Final Takeaway
There is no magic trade count that proves a trading strategy is profitable. As a practical framework, use 20–50 trades as an early diagnostic period, around 100 trades as an initial review point, and 200–300+ trades as a stronger evidence base when the strategy and market allow it. Most importantly, cover different market conditions, include realistic costs and measure drawdown.
A strategy should earn your confidence through repeated evidence, out-of-sample testing and forward testing—not through one short winning streak.
TradeOG Disclaimer
This article is for educational and informational purposes only and does not constitute financial, investment or trading advice. Trading forex, CFDs, gold and other leveraged instruments involves substantial risk of loss. Past performance, backtest results and historical trade samples do not guarantee future results. Always consider your financial situation, risk tolerance, broker conditions, transaction costs and applicable laws before trading. TradeOG does not guarantee the accuracy, completeness or future performance of any strategy discussed on this website.
Related TradeOG guides: Why Can a High Win Rate Strategy Still Lose Money?, How Can Traders Tell Whether a Strategy Is Overfitted to Historical Data?, Why Do Trading Strategies Stop Working During Different Market Conditions?, and How Does Decision Fatigue Affect Trading Performance?.