

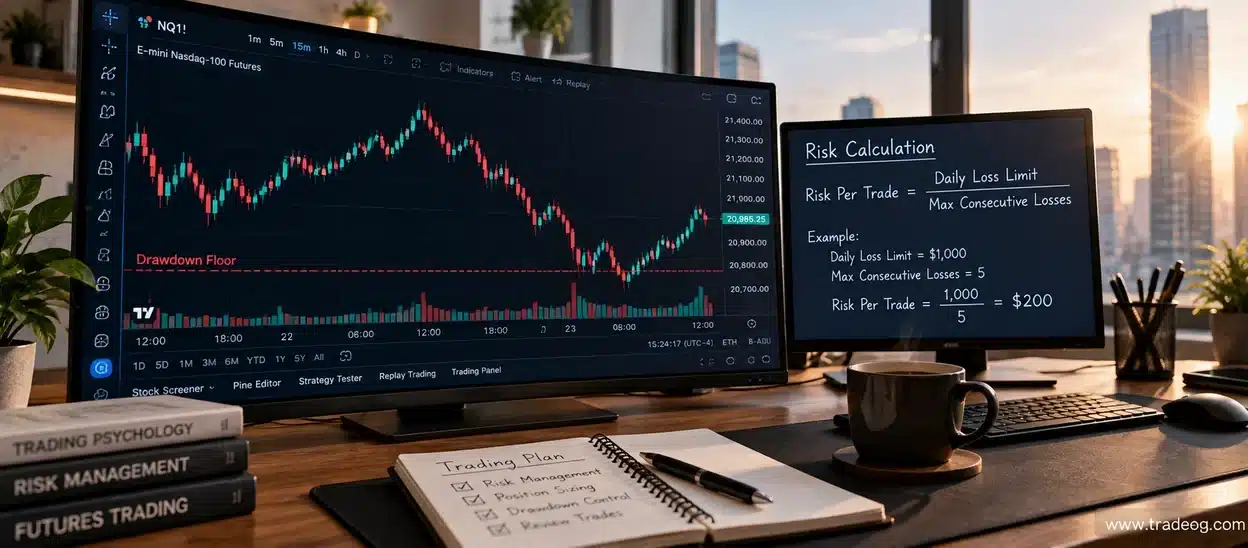

Most retail traders believe that their account drawdown is calculated at the end of the day or when a trade is closed. In the prop firm industry, that misconception is the single most common cause of sudden, unexpected account terminations.
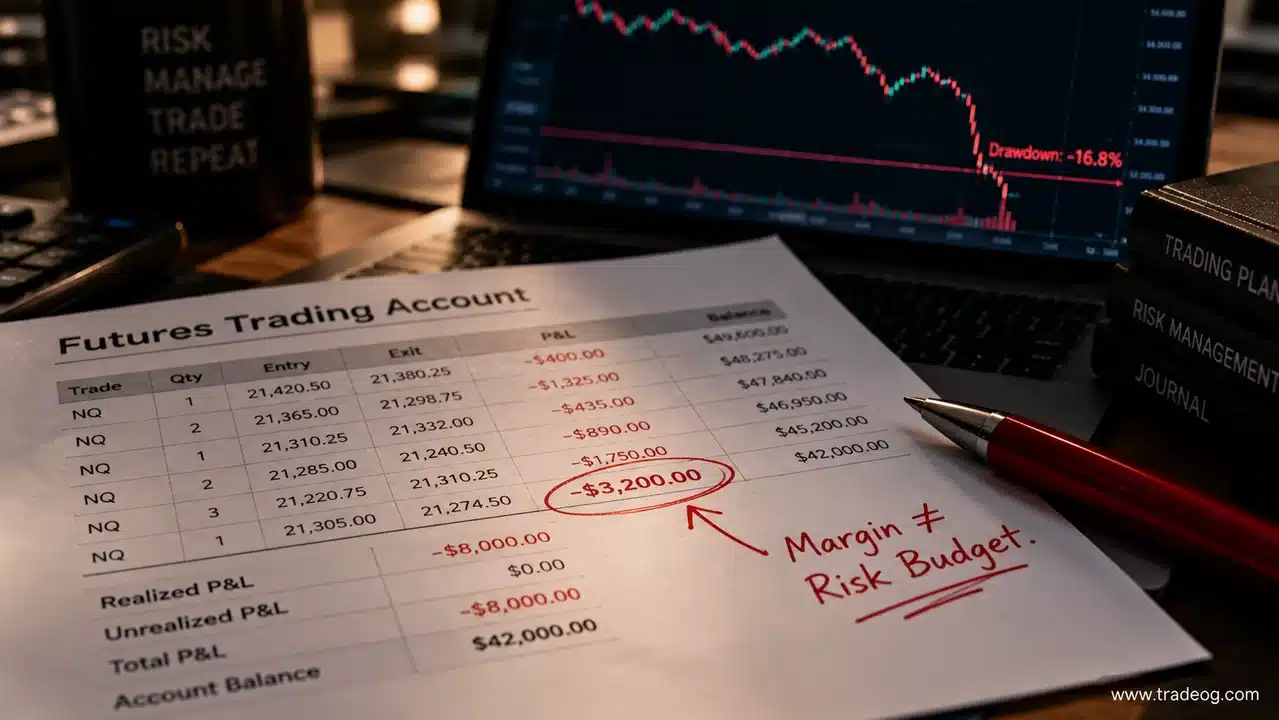
Prop firms do not wait for you to close a trade to measure risk. Their server-side risk monitoring engines track live, tick-by-tick equity drawdown while your positions are open. If your floating equity breaches the liquidation floor for even fifty milliseconds during a volatile news wick, your account is closed instantly—regardless of where the candle ultimately settles.
To survive and pass prop firm evaluations, you must understand the exact formulas, server mechanics, and pricing feeds that dictate how open equity is evaluated in real time. Here is the mathematical reality behind how prop firms calculate equity drawdown during active trades.
1. The Foundation: How Server-Side Equity Is Calculated
At any given millisecond, your account exists in two states: Balance (settled, realized capital) and Equity (liquidatable capital). The risk bridge connected to your trading platform (MT4/MT5, cTrader, Match-Trader, or DXtrade) calculates your equity using this core formula:
Live Equity = Current Balance + Total Unrealized P&L - Open Commissions - Accrued SwapsNotice that open commissions and overnight financing charges are deducted immediately upon execution. If you open a 10-lot position with a $70 round-turn commission, your floating equity instantly starts at -$70 before the market has even moved a single fraction of a pip.
2. How Prop Firms Calculate Equity Drawdown During Trading
Related: equity vs balance and daily drawdown reset time.
The daily loss limit is the primary liquidation threshold in modern prop trading. Most tier-one firms (such as FTMO, FundedNext, and The 5%ers) enforce a Daily Equity-Based Drawdown calculated against the previous day’s closing state.
The Daily Floor Formula
At the daily market reset (typically 5:00 PM EST / 00:00 server time), the firm’s risk engine takes a snapshot of your account:
Daily Reference Baseline = MAX(Previous Day Closing Balance, Previous Day Closing Equity)Daily Liquidation Floor = Daily Reference Baseline - (Starting Account Size × Daily Limit %)Worked Example: The Mid-Session Trap
Suppose you have a $100,000 account with a 5% ($5,000) daily loss limit:
- On Monday, you have a profitable session. At 5:00 PM EST market close, your closed balance is $100,000, but you have an open swing trade floating at +$2,000 profit. Your closing Equity is $102,000.
- Because the engine uses
MAX(Balance, Equity), your new Daily Reference Baseline for Tuesday is set at $102,000. - Your Tuesday Daily Loss Floor is calculated as:
$102,000 - $5,000 = $97,000 - On Tuesday morning, your swing trade retraces from +$2,000 back to -$3,100.
- Your account equity is now:
$100,000 (Balance) - $3,100 (Floating Loss) = $96,900
Result: Account Terminated. Even though your realized balance never dipped below $100,000, and your floating loss was only $3,100 relative to your starting deposit, your live equity fell below the $97,000 floor set by Monday’s peak close. This is how profitable traders get liquidated without realizing their daily limit was adjusted upward.
3. How Intraday Trailing Drawdown Tracks Open Equity Peaks
If you trade futures prop firms (e.g., Apex, Topstep) or specific CFD models with trailing parameters, the calculation is even more aggressive. In these models, the drawdown floor trails your highest intraday peak equity in real time.
Trailing Floor = Peak Intraday Equity - Maximum Drawdown Allowance| Step | Open Trade State | Account Equity | Drawdown Floor (Buffer: $2,500) | Remaining Buffer |
|---|---|---|---|---|
| 1. Entry | Trade opened at break-even | $50,000 | $47,500 | $2,500 |
| 2. Peak Profit | Trade surges into +$1,800 profit | $51,800 | $49,300 (Floor trails up) | $2,500 |
| 3. Retracement | Trade pulls back to +$200 profit | $50,200 | $49,300 (Floor stays locked) | $900 |
| 4. Normal Pullback | Trade dips to -$800 before reversal | $49,200 | $49,300 (Floor breached) | -$100 (BREACH) |
Under an intraday trailing calculation, an open trade that moves deep into profit and subsequently pulls back to a modest loss can trigger a terminal liquidation while still sitting above the original account balance. The trailing algorithm locks the floor at the highest tick.
4. The Hidden Execution Factor: Bid vs. Ask Price Feeds
A critical technical nuance that retail traders overlook is how the broker’s risk plugin values open orders:
- Long Positions (Buys) are liquidated at the market Bid price. Therefore, your open floating equity on a buy position is continuously priced at the live Bid.
- Short Positions (Sells) are liquidated at the market Ask price. Your open equity on a short position is calculated against the live Ask.
The Spread Widening Liquidation
During low-liquidity periods (such as 5:00 PM EST session rollover or the seconds leading into an FOMC rate decision), the spread between Bid and Ask widens drastically. Even if the average price of an asset does not move:
- If you are short, the Ask price spikes upward, immediately reducing your open equity.
- If you are long, the Bid price drops downward, reducing your open equity.
If your open trade is floating within 0.5% of your daily limit, an artificial spread widening of 8 to 15 pips can trigger an automated liquidation without a single underlying price candle printing at your technical stop loss level.
5. Correlated Open Exposure: How Floating Losses Multiply
When multiple positions are open simultaneously, the firm’s monitoring daemon calculates aggregate equity as a continuous sum:
Total Floating Drawdown = Σ (Position 1 Floating P&L) + Σ (Position 2 Floating P&L) + ...Traders who enter multiple correlated pairs (for instance, long EUR/USD, long GBP/USD, and short USD/CHF) often treat them as independent risk units. However, because each pair is driven by the US Dollar index, an unexpected macroeconomic announcement causes all open positions to move in the same direction.
If each position floats a temporary -$1,200 drawdown during a volatility spike, your combined open equity drops by -$3,600 in seconds. On a $4,000 daily limit, that single correlated move consumes 90% of your failure runway.
6. Practical Risk Management Rules for Open Trade Equity
To ensure open equity fluctuations never jeopardize your account, follow these four operational standards:
- Set Your Risk Budget Against High-Water Mark Floors: Always check your client portal at the daily rollover (5:00 PM EST). If a swing trade closed in high profit, identify your new daily baseline and resize your morning trades to match the tighter buffer.
- Never Run Unhedged Runners Into Daily Close: If you trade intraday, close open positions before 4:30 PM EST to avoid being caught in bank rollover spread expansions.
- Cap Maximum Open Risk at 50% of the Daily Limit: If your daily limit is $5,000, your combined maximum open stop loss exposure across all active positions should never exceed $2,500. This provides a 50% safety cushion to absorb slippage, commissions, and spread excursions.
- Lock In Gains Aggressively on Intraday Trailing Models: When trading under tick-by-tick trailing rules, scale out 50% to 75% of your position as price reaches key technical targets. Do not let open profits float without trailing stop protection.
Frequently Asked Questions (FAQ)
Does the prop firm calculate equity drawdown on closed trades only?
No. In all standard equity-based models, drawdown is evaluated tick-by-tick across both open and closed positions. Floating unrealized losses count immediately toward your daily and maximum drawdown limits.
Can a trade that closes in profit still breach the daily loss limit?
Yes. If the trade’s open floating equity dipped below the daily loss threshold at any point during its lifecycle, the automated risk engine registers a breach at that exact millisecond. Subsequent market recovery does not invalidate the breach.
How do commissions affect open equity drawdown?
Commissions are deducted from your balance/equity immediately when the position is opened. For large lot sizes, commission friction immediately reduces your distance to the drawdown floor.
Summary
Prop firm equity drawdown is an active, real-time mathematical monitoring process. It does not wait for daily summaries, closed order confirmations, or technical candle closures. By understanding the MAX(Balance, Equity) baseline formula, factoring in Bid/Ask spread dynamics, and capping open risk conservatively, you can execute with confidence and protect your funded account from unexpected server-side liquidations.


[…] Many retail traders make the fatal mistake of ignoring floating drawdown, believing that “it isn’t a loss until I close the trade.” In modern prop firm trading, this delusion is lethal. Automated risk monitoring algorithms track tick-by-tick equity; an uncontrolled floating drawdown can trigger an instantaneous account liquidation before your stop loss is even touched. To understand how broker servers process open trade drawdowns, read our in-depth breakdown on how prop firms calculate equity drawdown during open trades. […]
[…] Because these models vary widely, Indian traders must review their firm’s contract addendum rather than assuming rules from social media discussions. To understand how automated monitoring works, read our guide on how prop firms calculate equity drawdown. […]