


Introduction: The Number That Decides Whether You Keep Your Funded Account

Ask ten funded traders how much they risk per trade, and nine will confidently say “1%.” It sounds disciplined. It sounds professional. It is also the single most common reason prop firm accounts get blown.
Here’s the uncomfortable truth: a prop firm account is not a personal brokerage account. The $100,000 balance on your screen is not $100,000 you can afford to lose. It is a simulated number that controls your leverage — but your actual risk budget is the distance between your current equity and the firm’s maximum loss floor.
Get that distinction wrong, and a normal losing streak doesn’t just dent your account. It ends it.
This guide breaks down exactly how much you should risk per trade in a prop firm account, why the popular “1% rule” can be dangerously aggressive in 2026, and how to calculate a risk percentage that keeps you funded through the inevitable bad weeks.
The 1% Rule Was Never Designed for Prop Firms
The 1% rule originated in personal trading and institutional risk management. The logic is simple: if you risk 1% per trade, even ten consecutive losses only cost you 10% of your capital. You live to trade another day.
That logic works on a personal account where a 10% drawdown is painful but survivable. On a prop firm account with a 6–10% maximum loss limit, a 10% drawdown is a terminated account.
Consider the arithmetic. On a $100,000 account with an 8% static maximum loss, your total failure buffer is $8,000. At 1% risk per trade, that’s $1,000 per trade — eight losing trades and you’re done. But here’s the part traders miss: that same account likely has a 4–5% daily loss limit. Your daily failure buffer is $4,000–$5,000. At 1% risk, four or five losing trades in a single day ends your evaluation or funded account.
AIFO’s 2026 guide puts it bluntly: a 1% trade on a $100,000 account with a 5% max loss uses 20% of your real failure buffer in a single idea. “The account heard something else. It heard one fifth of the maximum loss allowance”.
The balance is not your risk budget. The distance to the floor is your risk budget. On most evaluation accounts, those two numbers differ by an order of magnitude.
The Recommended Risk Range for Prop Firm Accounts in 2026
Industry consensus has shifted decisively. The old “1–2%” advice has been replaced by a far more conservative range tailored to prop firm failure buffers.
For Challenge / Evaluation Phase: 0.25%–0.5% Per Trade
Multiple 2026 sources converge on this range. Orion Funded recommends 0.25%–0.50% per operation for funded accounts, noting that this range gives traders enough room to execute without being “glued” to the daily limit. For Traders’ 2026 challenge guide confirms that risking 0.25–0.5% per trade on a $50,000 account keeps you inside a 5% daily cap even after four consecutive losers.
The math is compelling. On a $50,000 account with a 5% daily loss limit ($2,500):
-
At 0.25% risk ($125/trade), you need 20 consecutive losses to hit the daily limit
-
At 0.5% risk ($250/trade), you need 10 consecutive losses
-
At 1% risk ($500/trade), you need just 5 consecutive losses
For a $100,000 account, the same logic applies. At 0.5% ($500/trade), you have 10 trades of room before the daily limit. At 1% ($1,000/trade), that drops to 5.
For Funded / Performance Phase: 0.5%–1% Maximum
Once you’re funded, the risk calculus shifts slightly. You’re no longer trying to hit a profit target — you’re trying to preserve the account and generate consistent withdrawals. PropTally’s 2026 trading plan framework recommends 0.25–0.75% per trade for funded accounts and a personal daily stop at 1.5%, well below the firm’s typical 4–5% limit.
Tradyom’s funded account guide caps recommended risk at 0.5–1% per trade, meaning on a $100,000 account, your maximum loss per trade should be $500–$1,000. This gives you room for a 5–10 trade losing streak without breaching drawdown limits.
The key insight: your personal limits should always be tighter than the firm’s rules. If the firm’s daily loss limit is 4%, set your personal stop at 2%. That buffer is what keeps you funded.
How Daily Loss Limits Change Your Risk Per Trade
Your risk per trade cannot be calculated in isolation. It must be sized against your daily loss limit — and that limit counts open floating losses, not just closed trades. This is the single most common mid-trade breach that kills prop accounts.
Here’s the practical framework:
Step 1: Identify your daily loss limit. Most firms set this at 4–5% of account balance. Some use 3%. Hantec Trader, for example, sets a 2% daily loss limit calculated on the previous day’s end-of-day balance or equity, whichever is higher.
Step 2: Set a personal daily stop well below the firm’s limit. If the firm allows 5%, stop trading at 2.5% losses. This buffer absorbs slippage, widened spreads, and correlated losses across open positions.
Step 3: Divide your personal daily stop by the maximum number of losses you expect in a bad session. If your personal daily stop is 2% and you want to survive 5 consecutive losses, your maximum risk per trade is 0.4%.
Step 4: Cross-check against your maximum loss buffer. On a $100,000 account with a 6% max loss, your total failure buffer is $6,000. At 0.5% risk ($500/trade), you can absorb 12 full losing trades before termination. At 1%, that drops to 6 — a normal losing streak for most strategies.
The correct risk percentage is the lowest amount produced by these calculations.
What the Firms Themselves Recommend
Prop firms have different philosophies on risk per trade. Some set hard rules; others offer recommendations.
FTMO explicitly does not set universal limits on how much of the account balance can be risked on a single trade, nor on the reward-to-risk ratio. However, FTMO recommends risking 1–1.5% per trade as a best practice — not a restriction. Occasional larger positions can be part of a healthy approach provided they’re based on a well-designed strategy.
FundingTraders recommends risking no more than 1.5% of an account per trade idea, with a maximum risk per trade idea of 1% for a $100K account.
E8 Markets recently launched a one-step Zero account that scraps the consistency rule and trailing drawdown — part of a broader 2026 trend of firms simplifying their rulebooks to attract traders who want fewer restrictions.
Apex Trader Funding operates under a different framework. Its legacy 30% negative P&L rule caps the maximum loss per trade at 30% of accumulated profit. If your account reaches $103,000 with $3,000 profit, the maximum allowable loss per trade is $900 — which translates to 0.87% of the total account balance.
The pattern is clear: firms that don’t set hard risk-per-trade rules still expect traders to exercise discipline. The absence of a rule does not mean the absence of a consequence.
The Consistency Rule: The Hidden Risk Multiplier
Most traders focus on drawdown limits when sizing positions. They forget about the consistency rule — which, according to industry data, accounts for an estimated 10–15% of prop firm evaluation failures.
The consistency rule limits how much of your total profit can come from a single trading day. Most firms set the threshold between 30% and 40%. If 40% of your profit comes from one exceptional day, you may be blocked from a payout until your results look more evenly distributed.
This has a direct impact on risk per trade. Traders who risk 1–2% per trade and catch a strong trend can generate 10–15% in a single day. That spike day can then violate consistency rules — even though the trades themselves were profitable.
The fix: size positions so that your best day doesn’t exceed 30% of your total profit target. If your target is 8% and you need 20 trading days, your average daily gain should be 0.4%. A 3% day is already 37.5% of your total profit — dangerously close to a 40% consistency cap.
One prop firm CEO went as far as calling the consistency rule “a payout trap” rather than a genuine risk-management tool, arguing it typically caps the share of total profit that can come from a single trading day. Whether you agree or not, the rule exists — and it must factor into your position sizing.
How to Calculate Your Exact Risk Per Trade (Step-by-Step)
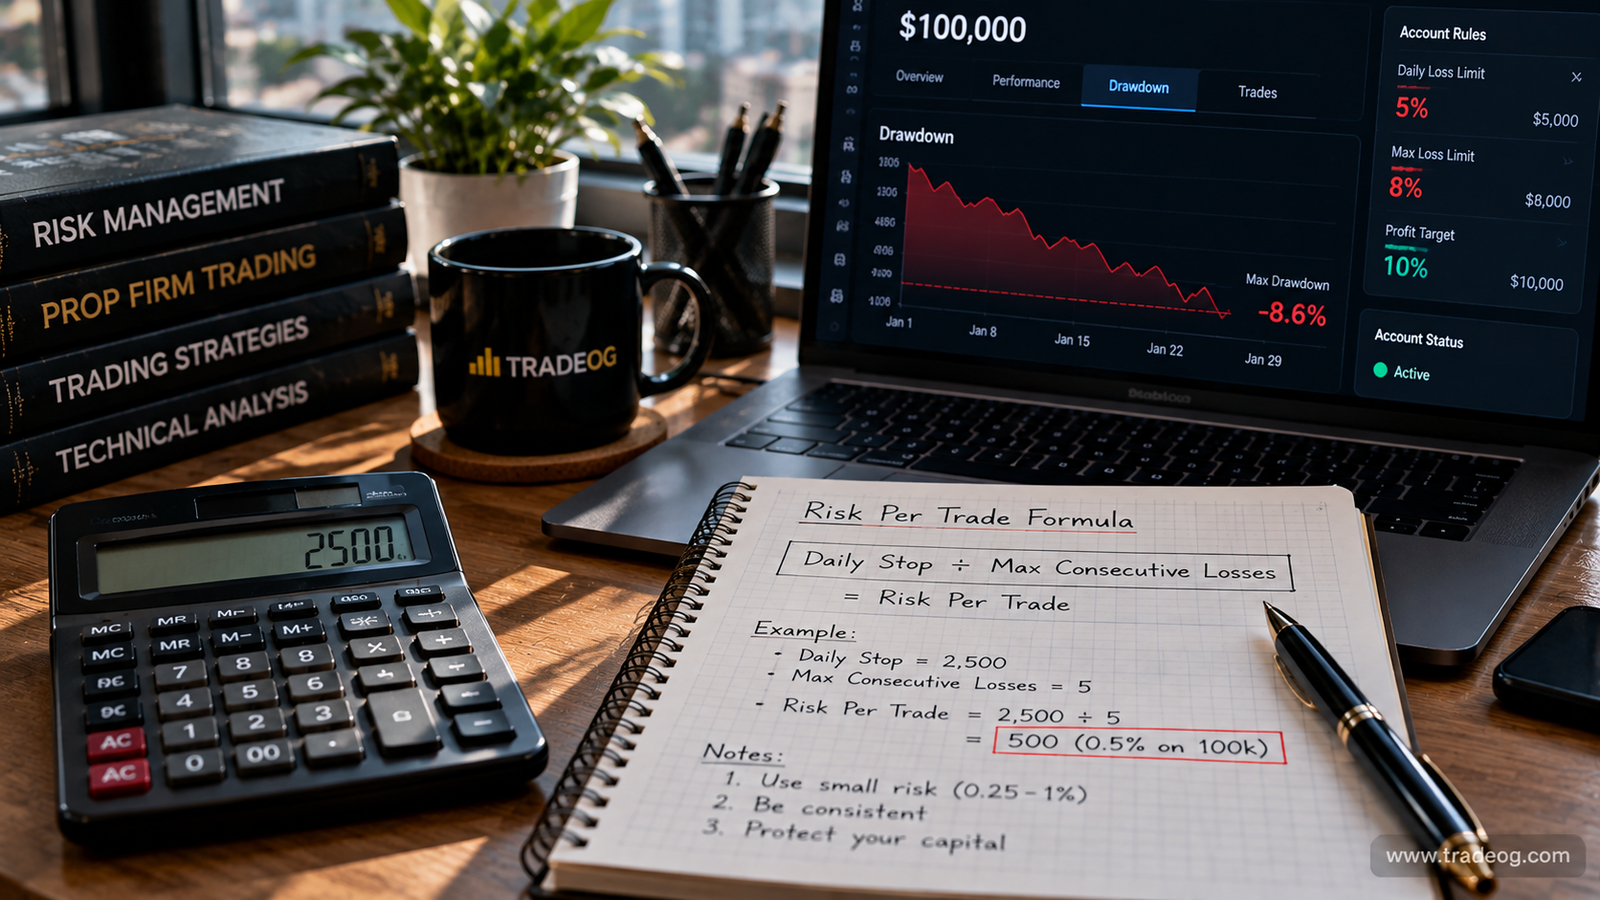
Here’s the calculation framework used by professional funded traders in 2026:
The Three Numbers You Need
Before sizing any trade, you need three specific values — and two of them change:
-
The drawdown formula. Static or trailing? If trailing, does it track closed balance or intraday equity? A floor that moves during the session makes your risk unit stale before you place the order.
-
The floor’s current value. Under a static rule, this is one number you write down once. Under a trailing rule, it’s a moving figure most platforms don’t display — you maintain it yourself or you’re sizing against a guess.
-
The daily limit and its reset time. The daily limit binds before the maximum does, and it resets on the firm’s clock, not yours. A trader in New York working to a European server reset can find the limit refreshed mid-session without realizing it.
The Calculation
Once you have those three numbers:
-
Calculate your real failure buffer: current equity minus the maximum loss floor.
-
Identify your daily failure buffer: daily loss limit minus any losses already incurred today.
-
Decide your personal daily stop: typically 50% of the firm’s daily limit.
-
Decide your maximum consecutive losses: how many losses in a row can your strategy produce?
-
Risk per trade = Personal daily stop ÷ Maximum consecutive losses.
-
Cross-check: Does this risk per trade × 10 stay within your real failure buffer? If not, reduce risk further.
Example: $100,000 Account, 5% Daily Limit, 8% Max Loss, 0.5% Trailing Drawdown
-
Real failure buffer: $8,000
-
Daily failure buffer: $5,000
-
Personal daily stop: $2,500 (2.5%)
-
Max consecutive losses: 6
-
Risk per trade: $2,500 ÷ 6 = $416 (0.42%)
-
Cross-check: $416 × 10 = $4,160 — safely within $8,000 buffer ✓
Risk Per Trade vs. Risk Per Idea vs. Simultaneous Risk
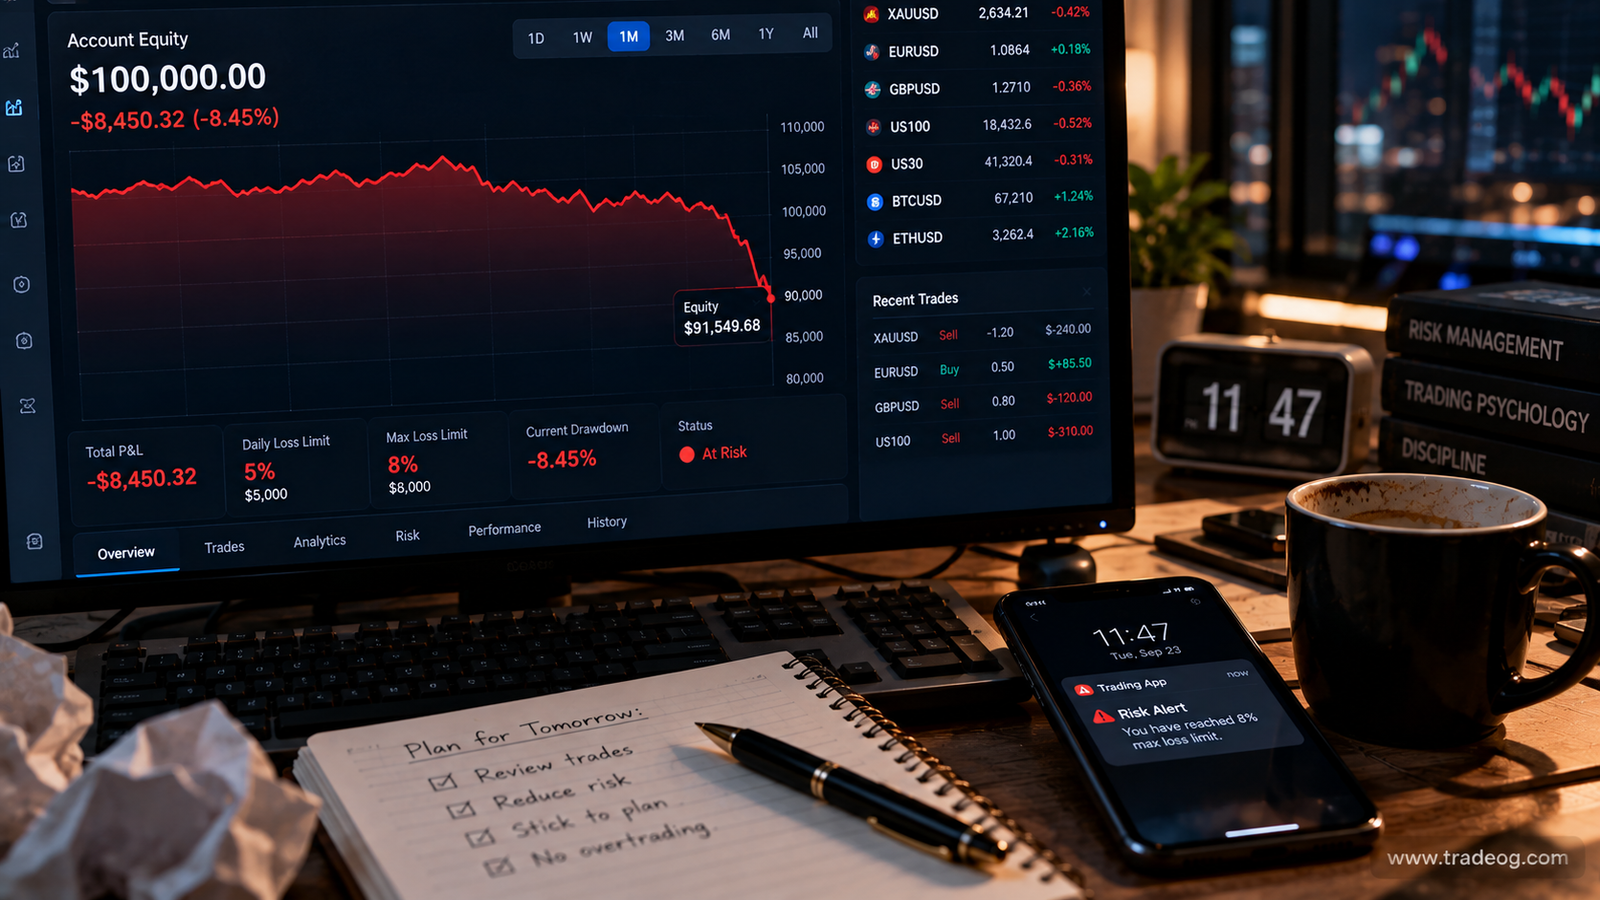 Most traders make a critical error: they treat each position as an independent risk unit. In prop trading, it doesn’t work that way.
Risk per idea: If you make three entries in the same direction for the same reason, they are not three independent trades. They are one idea with cumulative risk. Orion Funded’s guide emphasizes defining a maximum risk per idea and respecting it.
Simultaneous risk (open risk): If you have four positions open at once, your total open risk is the sum of all four. A correlated move against you can trigger all four stops simultaneously. PropTally recommends capping maximum open risk at 2% during challenges and 1.5% during funded phases.
Practical rule: Your combined open risk across all positions should never exceed 2× your per-trade risk. If your per-trade risk is 0.5%, your maximum simultaneous exposure should be 1%. This prevents a single market event from consuming your entire daily buffer.
Red Flags That Mean Your Risk Is Too High
How do you know if your current risk per trade is too aggressive? Watch for these warning signs:
-
A single loss materially changes your account state. If losing one trade makes you feel pressure to “make it back,” your size is too large. At 0.25–0.5% risk, one loss should be psychologically insignificant.
-
Three consecutive losses approach your personal daily stop. At proper sizing, you should be able to absorb 6–10 consecutive losses without hitting your personal limit. If three losses get you close, you’re oversized.
-
Your best day exceeds 30% of your total profit. This triggers consistency rule risk. If one good day accounts for more than a third of your gains, you need to either reduce size or spread profits across more days.
-
You check your P&L compulsively during a trade. This is a psychological symptom of oversized risk. At proper sizing, you should be able to walk away from a trade knowing the outcome won’t threaten your account.
-
You’ve never calculated your real failure buffer. If you don’t know the exact dollar amount between your current equity and the termination floor, you cannot possibly size correctly.
Building Your Personal Risk Framework for 2026
Here’s a practical template you can adapt:
| Parameter | Challenge Phase | Funded Phase |
|---|---|---|
| Risk per trade | 0.25–0.5% | 0.5–0.75% |
| Max risk per idea | 0.5% | 1% |
| Max open risk (all positions) | 1% | 1.5% |
| Personal daily stop | 2% (below firm’s 4–5%) | 1.5% (below firm’s 4–5%) |
| Max trades per day | 3–4 | 2–3 |
| Max consecutive losses before stopping | 2 | 2 |
| Best day as % of total profit target | Below 25% | Below 25% |
Notice that every personal number is below the firm’s actual limit. That buffer is not paranoia — it’s what separates traders who keep their accounts from traders who blow them.
Final Thoughts: The Trader Who Sizes Small, Lasts Long
The prop firm industry has spent 2026 simplifying rulebooks, removing friction, and making it easier for traders to understand what’s expected. But no amount of rule simplification changes the fundamental math: your risk per trade determines how many mistakes you can survive.
At 0.25–0.5% risk per trade, a string of losses is a setback. At 1–2%, it’s a termination event. The difference between a funded trader who lasts six months and one who lasts six days is rarely strategy. It’s position sizing.
Calculate your real failure buffer. Set your personal daily stop below the firm’s limit. Risk a fraction of what the internet tells you is “standard.” And remember: the goal is not to maximize profit per trade. The goal is to still be trading next month.
Size small. Stay funded. Withdraw consistently.


[…] statistical inevitability is why understanding how much to risk per trade in modern accounts is the boundary separating professional long-term operators from short-lived retail […]