



Introduction: The Number Most Traders Get Wrong
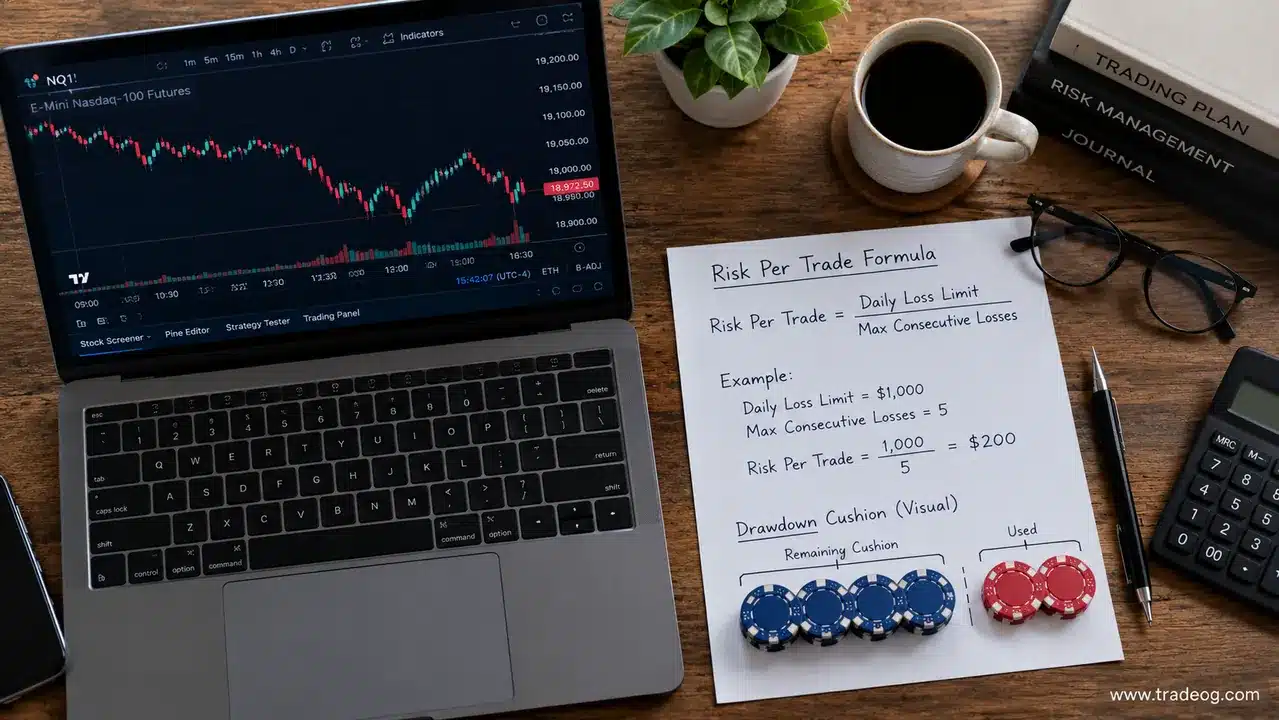
Most traders pick a prop firm, glance at the drawdown allowance, and then size positions based on intuition. “Feels like two contracts” or “I usually trade this size.” The drawdown number becomes background noise — something they worry about rather than calculate with.
This is backwards. On a prop firm account, your position size is not a preference. It is an output. It is determined entirely by the drawdown allowance and the length of losing streak you need to survive.
Get this calculation right, and passing becomes a waiting game. Get it wrong, and no amount of setup quality saves the account.
This guide gives you the exact formula — and shows you how to apply it whether your firm uses static or trailing drawdown.
The Core Formula: From Drawdown to Position Size
Every prop firm position sizing calculation starts with the same three inputs:
-
Usable drawdown — the dollar amount you can actually lose before the account closes
-
Streak to survive — how many consecutive losses your strategy must endure
-
Stop distance — how far your stop-loss sits from entry, in ticks or points
From these, everything follows.
Step 1: Calculate Your Risk Per Trade
Risk per trade ()=Usabledrawdown() ÷ Streak to survive
A defensible streak target is 12 to 20 consecutive losses. Below 10, you’re one ordinary losing run from failure. Above 25, the profit target usually becomes unreachable inside the time limit.
Worked on a $100,000 account with a 5% maximum drawdown ($5,000 allowance):
| Streak to Survive | Risk Per Trade | As % of Account |
|---|---|---|
| 10 | $500 | 0.50% |
| 15 | $333 | 0.33% |
| 20 | $250 | 0.25% |
But here’s the critical adjustment most traders miss: the headline allowance is not what you actually get to use. Subtract slippage, spread costs, and a safety buffer. On a $5,000 allowance, a realistic usable figure is closer to $4,000. Divide that instead.
Step 2: Convert Risk Per Trade into Position Size
Position size = Risk per trade ($) ÷ Stop distance (per unit)
For futures, the full formula is:
Max contracts = (Drawdown allowance × Risk fraction) ÷ (Stop distance in ticks × Tick value)
For forex:
Lot size = Risk per trade ($) ÷ (Stop distance in pips × Pip value)
Static vs Trailing Drawdown: The Formula Changes
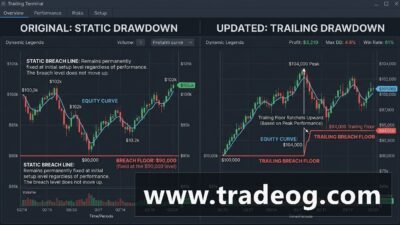
The formula above assumes a static drawdown — a fixed floor calculated from your starting balance. FTMO, for example, uses a 10% static drawdown: on a $100,000 account, your equity can never fall below $90,000, no matter how high the account climbs.
But many prop firms — especially futures firms like Apex and Topstep — use trailing drawdown. Here, the floor follows your equity high-water mark upward and never resets lower. If your account grows from $100,000 to $110,000, the floor rises to $99,000 (with a 10% trailing). Any pullback from that new high moves you closer to termination.
This changes the math fundamentally.
The Dynamic Cushion Formula
On a trailing drawdown account, your usable drawdown is not fixed. It fluctuates continuously as the floor moves.
Current cushion = Current equity (including open P&L) − Current floor
The trap: most platforms show your account balance or net liquidation — current equity including unrealized P&L. They don’t necessarily show the current floor position. You need both numbers to calculate your cushion.
Why Fixed Dollar Beats Fixed Fractional Under Trailing Drawdown
Under a trailing drawdown, fixed dollar risk is close to mandatory. Scaling risk with balance leaves your streak tolerance unchanged while the consequences grow. If your floor moves up with your balance, a 1% risk on a larger account is a larger dollar loss against a floor that has also moved up — but your buffer in percentage terms stays the same.
The practical rule: on trailing drawdown accounts, size every trade from the current cushion, not from the account balance.
Worked Example: Apex PA $100K, NQ Futures
Let’s run the full calculation.
Account: Apex PA $100K
**Maximum trailing drawdown:** $3,000
Instrument: NQ (Nasdaq futures)
Tick value: $5.00
Planned stop: 10 ticks (2.5 points)
Step 1: Set your risk fraction. You decide to risk 2% of the drawdown per trade.
Step 2: Calculate risk capital per trade.
$3,000 × 0.02 = **$60**
Step 3: Calculate dollar value of stop per contract.
10 ticks × $5.00 = **$50 per contract**
Step 4: Calculate max contracts.
$60 ÷ $50 = 1.2 contracts → round down to 1 contract
At 2% risk of the $3,000 drawdown, a 10-tick NQ stop supports 1 contract comfortably. Want 2 contracts? Either increase risk percentage (to 3.3%+) or widen the stop distance. Those trade-offs have strategic implications — neither is automatically right or wrong.
The Tier System: Adaptive Sizing for Trailing Drawdown

Static position sizing breaks down on trailing drawdown accounts because the floor moves while you trade. A dynamic model that adjusts contract count based on current cushion is how professionals handle it.
The practical implementation is a tier system rather than continuous real-time calculation. Pre-define the position size for each cushion range, so the decision at entry is simply: “what tier am I in right now?”
Example tier system for Apex PA $100K (max drawdown $3,000), trading NQ:
| Cushion Level | Contract Size | Rationale |
|---|---|---|
| $2,500 – $3,000 (100% – 83%) | 2 NQ (or 20 MNQ) | Full size — cushion is healthy |
| $1,800 – $2,500 (60% – 83%) | 1 NQ (or 10 MNQ) | Reduced — cushion has compressed |
| $1,000 – $1,800 (33% – 60%) | 5 MNQ | Minimum viable — protect remaining cushion |
| Below $1,000 (<33%) | 1-2 MNQ or flat | Emergency — preserve the account |
These thresholds are illustrative. Calibrate them to your specific account size, risk tolerance, and strategy. The principle — full size at healthy cushion, stepped reductions as cushion compresses — is what matters.
A similar scaling framework used by professional trade copiers: Cushion >80% = full ratio (1.0x), 60–80% = 0.75x, 40–60% = 0.5x, 20–40% = 0.25x.
The Profit Target Check: Can You Still Pass?
Small risk is only correct if it can still get you to the target in time. This is the step most traders skip.
Trades needed ≈ Profit target ÷ (Risk per trade × Expectancy in R)
Example: $4,000 target, $250 risk per trade, 0.35R expectancy.
4,000 ÷ (250 × 0.35) ≈ 46 trades
If your setup appears three times a week, that’s about fifteen weeks. Fine for an unlimited-time program. Impossible on a 30-day one.
When the arithmetic doesn’t fit, change the program or the strategy. Never the risk.
Step-by-Step Implementation Guide
Here is the exact sequence to run before every trade on a prop firm account.
Before the session (once per day)
-
Identify your drawdown type. Static or trailing? End-of-day or intraday? Intraday trailing is the tightest — a temporary peak reached at 10am that is given back before the close still permanently raises your floor.
-
Calculate your current cushion. Current equity (including open P&L) minus current floor.
-
Subtract costs and buffer. Reduce the cushion by estimated slippage, spread, and a safety margin. Aim to use no more than 80% of the nominal cushion for risk calculations.
-
Determine your risk per trade. Cushion ÷ streak to survive (12–20).
Before every entry
-
Identify your technical stop. Where does the trade thesis invalidate? Size from invalidation, not from ambition.
-
Calculate position size. Risk per trade ($) ÷ Stop distance (per unit) = Position size.
-
Check the tier. Does this position size fall within your pre-defined tier for the current cushion level? If not, reduce to the tier limit.
After every trade
-
Recalculate the cushion. On trailing drawdown, a good day moves the fail level up and quietly shrinks the budget you had yesterday. Recalculate every morning.
Common Sizing Mistakes That Kill Prop Accounts
Mistake 1: Treating the Account Balance as Your Risk Capital
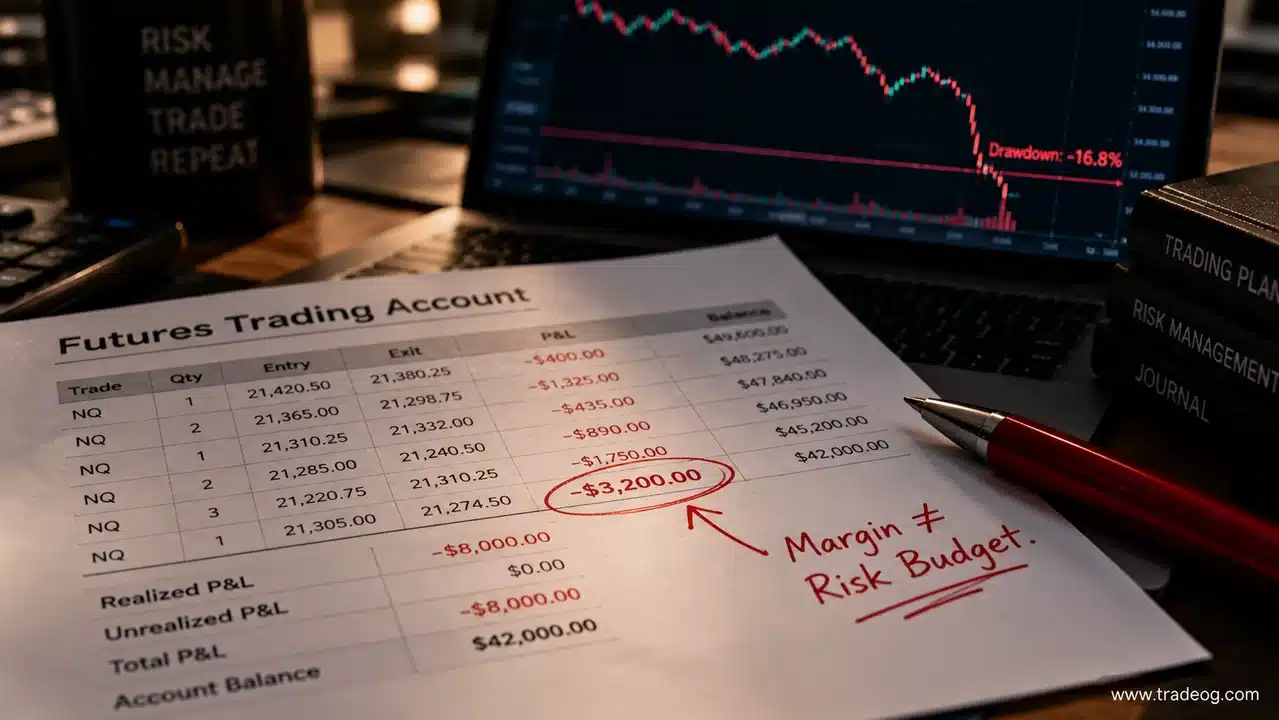
A $50,000 funded account with a $2,500 trailing drawdown does not give you $50,000 to work with. You have a $2,500 risk budget. The $50k label is a marketing convention, not a risk parameter.
On a personal $50,000 account with a 2% risk rule, you’d risk $1,000 per trade. On a funded $50,000 account with a $2,500 trailing drawdown, risking $1,000 per trade means a single bad trade wipes out 40% of your termination buffer. Three losses and you’re done.
Mistake 2: Confusing Margin Capacity with Sizing Capacity
Your broker may let you run 50 ES contracts on a $50k funded account. The margin is there. But 50 ES contracts that move 2 points against you is $5,000 — doubling your max drawdown in a single trade. Margin capacity and sizing capacity are completely different animals.
Mistake 3: Ignoring the Daily Loss Limit
Your risk per trade must fit inside your daily loss limit, not just your maximum drawdown. The daily limit binds before the maximum does, and it resets on the firm’s clock, not yours.
On a $100,000 account with a 5% daily limit ($5,000) and 0.5% risk ($500/trade), you have 10 trades of room. At 1% risk ($1,000/trade), that drops to 5. Most strategies cannot survive a 5-loss day without psychological damage.
Mistake 4: Sizing from Balance, Not from Cushion
The balance is not your risk budget. The distance to the floor is your risk budget. On most evaluation accounts, those two numbers differ by an order of magnitude.
Mistake 5: Forgetting Correlated Risk
If you have four positions open at once, your total open risk is the sum of all four. A correlated move against you can trigger all four stops simultaneously. Cap maximum open risk at 2× your per-trade risk.
Quick Reference: The Prop Firm Position Sizing Formula
| Step | Formula | What It Tells You |
|---|---|---|
| 1 | Usable drawdown = Headline allowance − Costs − Buffer | Your real risk capital |
| 2 | Risk per trade = Usable drawdown ÷ Streak to survive | Dollar risk per trade |
| 3 | Position size = Risk per trade ÷ Stop distance | Contracts or lots to trade |
| 4 | Trades needed = Profit target ÷ (Risk × Expectancy) | Whether the plan is viable |
For trailing drawdown accounts, replace “Usable drawdown” with “Current cushion” and recalculate daily.
Final Thoughts: The Formula Is the Edge
The drawdown number is not background noise. It is the single most important input in every position sizing decision you make on a prop firm account.
Run the math before you trade. Calculate your usable drawdown, divide by a realistic streak target, size from your technical stop, and check that the profit target remains reachable. If the arithmetic doesn’t work, change the program or the strategy — never the risk.
The traders who keep their funded accounts are not the ones with the best setups. They are the ones who sized every position from their drawdown buffer — and still had room to trade after the losing streak arrived.
Size from the buffer. Survive the streak. Pass the challenge.


[…] protect your funded status, always apply our verified formula for position size based on drawdown buffer before entering any […]
[…] Size for the Drawdown Buffer, Not the Account Balance: On a $100,000 account with a 10% ($10,000) max drawdown, your real risk capital is $10,000. Risking 1% of nominal balance ($1,000) is actually risking 10% of your remaining life. Professional funded traders risk 0.25% to 0.50% of nominal balance per trade. Learn the exact formula in our guide on position size based on drawdown buffer. […]