
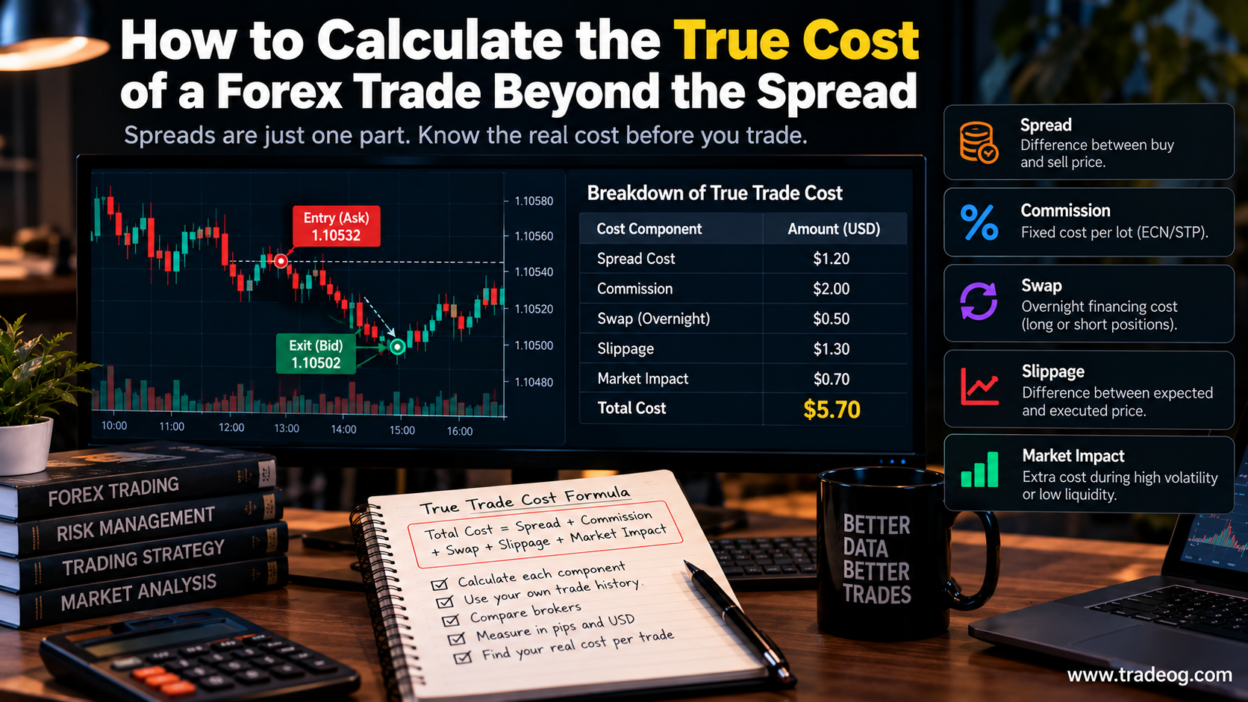
The spread is easy to notice on a trading platform, so it often becomes the number traders use to compare forex accounts. But it is only one part of what a trade can cost. Commission, overnight financing, slippage and currency conversion can all affect the final result. Some costs apply to every trade; others depend on how long you hold a position or the conditions when your order is filled.
If you want to compare brokers or find out why a strategy earns less than expected, calculate costs from your own account records rather than relying only on advertised pricing. The method below gives you a practical way to do that.
What counts as the true cost of a forex trade?
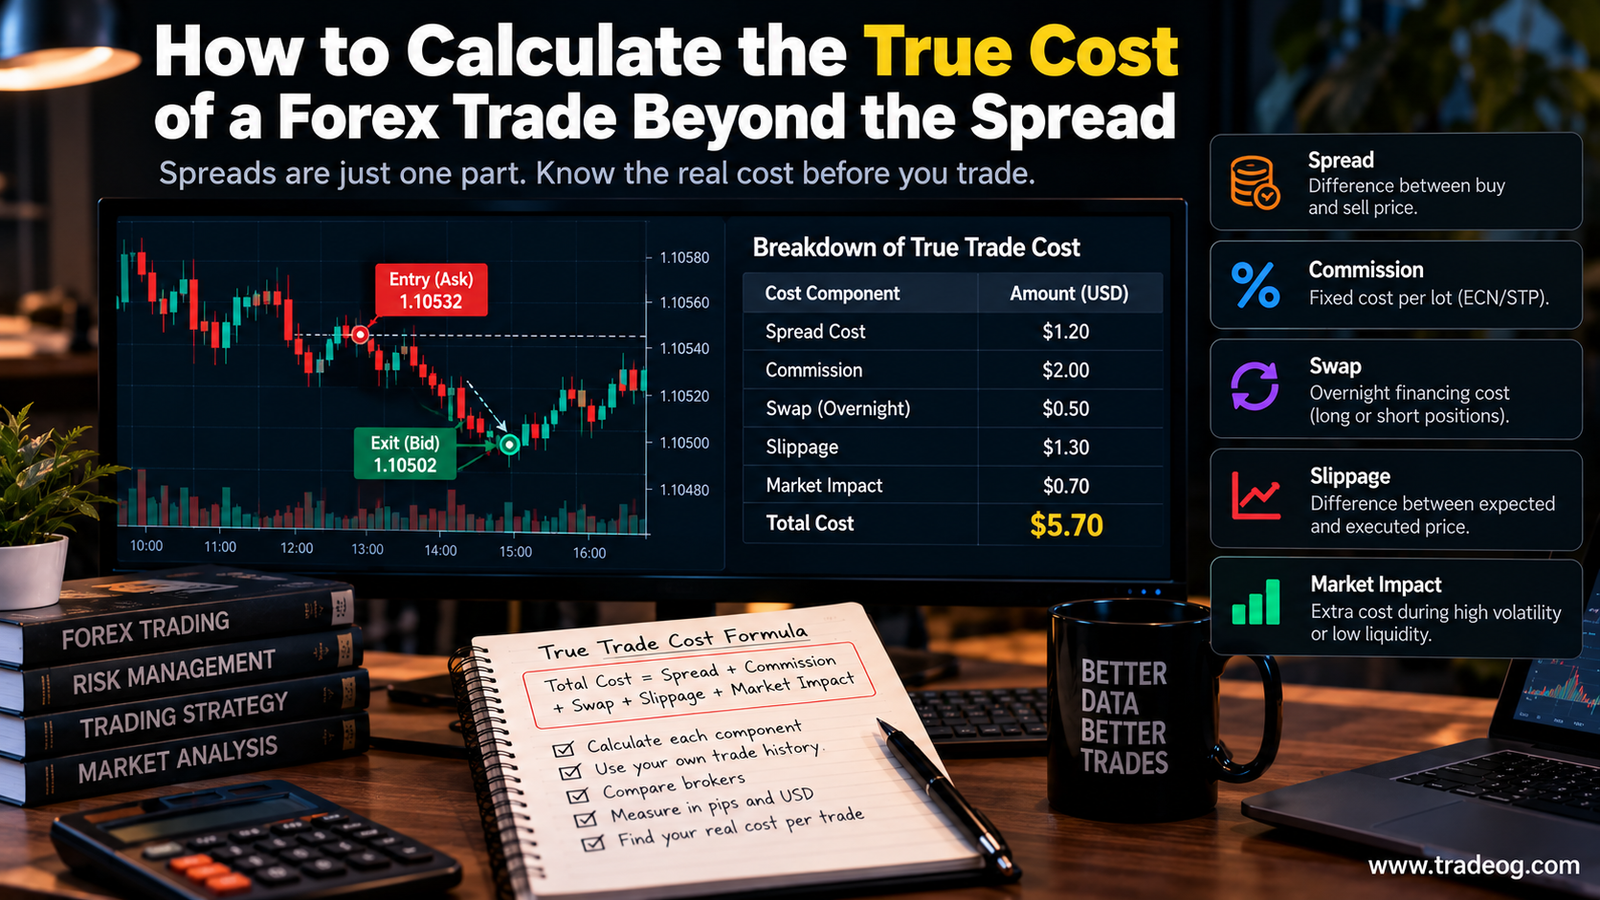
For a typical retail forex trade, the main cost components are:
- Spread: the difference between the Bid and Ask prices.
- Commission: a broker charge that may apply per side or per round turn.
- Swap or overnight financing: a debit or credit for holding a position past the broker’s rollover time.
- Slippage: the difference between the relevant reference price and the actual fill price.
- Currency conversion: a charge or conversion-rate difference when trading costs or profits are converted into your account currency.
- Other applicable fees: for example, a platform, inactivity or account fee if the broker charges one and it is relevant to your trading.
Market impact can also matter, particularly for larger orders or less liquid instruments. For many retail trades, it may be difficult to isolate market impact from spread and slippage, so do not add a separate estimate unless you have a defensible way to measure it.
1. Calculate the spread cost
The spread is the difference between the Ask, the price generally available to buy, and the Bid, the price generally available to sell. A quoted spread in pips can be converted into money using the trade’s pip value and position size.
Spread cost = spread in pips × pip value per lot × number of lots
For example, suppose you trade 1 standard lot of EUR/USD, the spread is 1.2 pips, and the pip value is approximately $10 per pip for that position. The spread cost is about 1.2 × $10 = $12. Pip value depends on the pair, trade size and account currency, so calculate it for the actual instrument rather than using $10 universally.
Spread is often paid through the difference between buy and sell prices rather than appearing as a separate cash charge. Be careful not to count it twice when using platform profit-and-loss figures that already reflect Bid/Ask pricing.
2. Add broker commission
Some accounts offer a wider spread with no separate commission, while others advertise raw or tight spreads and charge commission. A commission may be quoted per lot per side, for a full round turn, or using another pricing unit. Read the account terms carefully.
Round-trip commission = commission per side × 2 only when the broker’s quoted amount is per side for a complete open-and-close trade. If the rate is already stated as a round-turn amount, do not multiply it again.
Example: if the commission is $3.50 per lot per side and you open and close 1 lot, the total commission is $7.00. If you trade 0.2 lots under the same linear pricing, it would be $1.40 in total. Minimum commissions or special contract terms can change the result, so use the actual statement where possible.
3. Include swap and overnight financing
If you hold a position beyond the broker’s rollover time, a financing adjustment may be applied. The amount can depend on the currency pair, whether the position is long or short, the position size, current rates and the broker’s markup. Some instruments have different financing conventions, and rollover charges may vary by day.
Total financing cost = sum of the actual daily financing charges
Use the swap or financing entries in your account statement for the holding period. Do not assume a displayed rate will remain unchanged. A short-term intraday trade may have no overnight financing charge if it is closed before rollover, while a position held for several days can accumulate meaningful costs.
4. Measure slippage using actual fills
Slippage is the difference between the reference price at order submission and the price actually filled. It can be favourable or unfavourable. For a consistent analysis, define positive slippage as a worse result for you and record price improvement separately or as a negative value.
For a buy, one convention is (fill price − reference price) ÷ pip size. For a sell, use (reference price − fill price) ÷ pip size. The reference should be the executable quote recorded when you submitted the order—not a candle close selected afterwards.
Multiply adverse slippage in pips by the position’s pip value to estimate its monetary effect. For example, 0.4 pip of adverse slippage on a position worth $10 per pip is about $4. Apply the calculation consistently to entry and exit fills, and keep favourable fills in the dataset too.
If your platform does not preserve the reference quote or order-submission timestamp, you may not be able to calculate slippage accurately from the standard history export alone. Do not substitute a chart price and present it as exact execution data.
5. Account for currency conversion and other fees
If your account is denominated in a different currency from the instrument’s profit currency, realised costs and results may need conversion. The conversion rate used by the broker can affect the final account-currency amount. Record the actual converted charge or the broker’s documented conversion method rather than applying an arbitrary exchange rate.
Include account or platform fees only when they apply. If you want to calculate the cost per trade, decide how to allocate a monthly fixed fee across trades and disclose the method. Keep this separate from the direct cost of executing a particular order so comparisons remain clear.
6. Use one formula without double-counting
For a practical estimate of direct trade costs, use:
Total trade cost = spread cost + commission + financing + adverse slippage + applicable conversion and other fees
This is an analytical framework, not a universal accounting formula. If the platform’s realised P&L already includes spread and slippage, do not add those components again. Likewise, only include financing for the period actually held, and do not count favourable slippage as an adverse cost.
Consider a hypothetical round-trip trade with these measured amounts:
| Cost component | Example amount |
|---|---|
| Spread | $12.00 |
| Commission | $7.00 |
| Overnight financing | $2.50 |
| Net adverse slippage | $4.00 |
| Conversion or other fees | $0.00 |
| Total estimated cost | $25.50 |
These are illustrative numbers, not a quote from any broker. In this example, the total cost is $25.50 even though the spread alone was $12. This is why a spread-only comparison can be misleading.
7. Convert costs into pips to compare different accounts
Dollar amounts are useful for your own records, but pip-equivalent costs can help compare accounts with different position sizes. Divide the monetary cost by the pip value of the position.
Cost in pips = total cost in account currency ÷ pip value in account currency
For the example above, if the position’s pip value is $10, a $25.50 cost is equivalent to 2.55 pips. The conversion only makes sense when the pip value is appropriate for the same instrument and trade size.
For a fair broker comparison, use similar trade sizes, the same instrument, comparable trading sessions and the same holding period. One account may be cheaper during quiet hours but more expensive around news or rollover.
8. Build a cost log from your own trades
A spreadsheet makes the calculation repeatable. Keep one row per completed trade and include:
- Instrument, direction, lot size and open/close times
- Spread at entry and exit, where available
- Commission charged on each side
- Swap or financing entries
- Reference and fill prices for measured slippage
- Currency conversion and other charges
- Total cost in account currency and equivalent pips
Review the results by instrument, trading session, holding time and order type. A monthly average can hide a costly rollover or poor fills during high volatility. Keep the raw records so unusual values can be checked against broker statements and order logs.
Common mistakes when calculating forex costs
- Using the advertised minimum spread: measure the spread you actually faced, across the sessions when you trade.
- Forgetting commission on the exit: check whether the broker quotes a per-side or round-turn fee.
- Ignoring overnight charges: include financing when the position crossed rollover.
- Counting spread twice: check what your platform’s reported P&L already includes.
- Calling chart differences exact slippage: use a recorded executable reference quote and actual fill data.
- Comparing different trade sizes: convert results to a common unit and compare like with like.
Frequently asked questions
Is the spread the main cost of forex trading?
It is an important cost, but not always the largest. Commission, financing, slippage and conversion charges can materially change the total, depending on the account and how long you hold trades.
How do I compare a zero-spread account with a standard account?
Calculate the total cost for the same instrument, size, session and holding period. Include commission, actual spreads, slippage and financing rather than comparing the headline spread alone.
Do all forex trades have swap charges?
No. Financing generally depends on whether a position is held across the broker’s rollover time and on the product’s terms. Check your account statement and instrument specification.
Can I calculate true costs from MT4 or MT5 history?
You can usually retrieve realised trades and many charges, but detailed spread-at-entry and reference quotes for slippage may require platform logs or broker records. The available fields depend on the setup.
Risk note: Forex and CFD trading involves substantial risk. This guide is educational and does not recommend a broker or guarantee trading results.