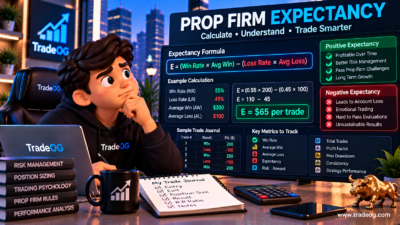

A prop firm trading journal is more than a list of winning and losing trades. It is a structured record that helps you understand why a trade worked, why it failed, how much risk you took, and whether your results are consistent with your trading plan.
For prop traders, this matters because a strategy can look profitable while poor position sizing, oversized losses, revenge trading, weak execution, or inconsistent trade selection gradually damages the account.
The goal is not to record every possible number. The goal is to track the metrics that help you answer three questions:
- Is my trading process consistent?
- Where is my risk actually coming from?
- Which setups and behaviors are producing or destroying my results?
Why Prop Traders Need a Trading Journal
Prop firm trading is usually governed by specific risk parameters. Depending on the program, traders may have daily loss limits, maximum loss limits, contract restrictions, consistency requirements, or other trading rules.
A journal gives you a personal risk-control layer on top of those external rules. Instead of reviewing your account only after a losing day, you can identify patterns before they become expensive mistakes.
For example, your overall win rate may be 55%, but your journal could reveal that most losing trades happen when you increase position size after two consecutive losses. That behavioral insight is often more useful than the headline win rate.
1. Total Trades
Start with the simplest metric: number of trades.
Track total trades by day, week and month. Then break them down by setup, instrument and session.
Trade count helps identify whether your activity matches your plan. A strategy designed for a few high-quality setups can produce very different results when a trader starts taking dozens of impulsive entries.
Useful journal fields include:
- Total trades
- Winning trades
- Losing trades
- Breakeven trades
- Trades per session
- Trades per setup
2. Win Rate
Win rate is the percentage of trades that close profitably.
Formula:
Win Rate = Winning Trades ÷ Total Trades × 100
Do not evaluate win rate by itself. A 70% win rate does not automatically mean a strategy is better than one with a 45% win rate. Average win, average loss, trading costs and risk per trade all matter.
Track win rate separately for each setup. This can show whether one setup is consistently outperforming another within your own trading data.
3. Average Win and Average Loss
Record the average dollar profit of winning trades and the average dollar loss of losing trades.
These two numbers give context to your win rate. A trader with a lower win rate can still have positive results when average winners are sufficiently larger than average losers.
For prop trading, also track these numbers in R-multiples, where 1R represents the amount you planned to risk on a trade.
- +1R = profit equal to planned risk
- +2R = profit equal to twice planned risk
- -1R = planned full loss
4. Profit Factor
Profit factor compares gross profits with gross losses.
Profit Factor = Gross Profit ÷ Gross Loss
For example, if your winning trades generate $4,000 and losing trades total $2,000, your profit factor is 2.0.
Track profit factor by strategy and by month rather than relying only on one lifetime number. A declining profit factor can indicate that market conditions, execution or discipline have changed.
5. Expectancy
Expectancy estimates the average amount your trading process produces per trade over a sufficiently large sample.
A simplified version is:
Expectancy = (Win Rate × Average Win) − (Loss Rate × Average Loss)
This metric combines win rate and payoff into one measurement. It is especially useful when comparing two setups that have different win rates and reward-to-risk profiles.
6. Maximum Drawdown
Maximum drawdown measures the largest decline from an equity peak to a subsequent trough during a selected period.
This is one of the most important metrics for prop traders because account drawdown rules can determine whether an account remains active.
Track:
- Maximum account drawdown
- Largest daily loss
- Largest losing streak
- Peak equity
- Lowest equity after the peak
- Remaining drawdown buffer
Do not only record the final monthly drawdown. Record when and why it occurred.
7. Risk Per Trade
Record the planned dollar risk before every trade.
For futures, your risk depends on factors such as stop distance, contract point value and number of contracts. A basic calculation is:
Trade Risk = Stop Distance × Dollar Value Per Point × Contracts
Then compare planned risk with actual loss. If actual losses repeatedly exceed your planned risk, investigate whether the cause is slippage, moving stops, adding to positions or poor execution.
8. Risk-to-Reward Ratio
Record the planned and realized risk-to-reward ratio.
A trade may be planned at 1:2 but close much earlier because of fear, or it may become a much larger loss because the stop was moved.
Track both:
- Planned R:R
- Realized R:R
The difference can expose execution and discipline problems that a normal P&L report will not show.
9. Setup Performance
Every trade should have a setup or strategy label.
Examples include breakout, pullback, trend continuation, reversal, liquidity sweep or another setup defined by your system.
After enough trades, compare each setup by:
- Number of trades
- Win rate
- Average R
- Profit factor
- Maximum drawdown
- Average holding time
This helps separate a strategy problem from a discipline problem.
10. Session and Time-of-Day Performance
Record when each trade was opened.
For example, separate your results into Asian, London, New York or specific market-opening windows when those sessions are relevant to your instruments.
You may discover that your strategy performs differently during the first hour of a major market session compared with quieter periods. Your own historical data should determine whether a session is suitable for your process.
11. Holding Time
Track how long each trade remains open.
Holding time can reveal behavioral patterns. If your profitable trades usually last 10–30 minutes while losing trades remain open for two hours, the difference deserves investigation.
Also compare holding time by setup. A scalp, intraday trend trade and swing position should not necessarily have the same time profile.
12. Slippage and Execution Quality
Record the difference between the price you expected and the price at which your order actually filled whenever the information is available.
Execution data becomes particularly useful during fast markets. Track:
- Requested entry price
- Actual fill price
- Requested exit price
- Actual fill price
- Slippage
- Spread or market conditions
For more context, see CME Group’s position and risk management education.
13. Consecutive Wins and Losses
Track your longest winning and losing streaks.
This is useful for understanding psychological and risk-management behavior. Some traders increase size after wins because of overconfidence, while others increase size after losses in an attempt to recover quickly.
Record what happened to position size during a streak. The goal is to determine whether your risk remains stable when your emotions change.
14. Rule Violations
This is one of the most important prop-firm-specific journal metrics.
Create a simple rule-violation counter. Examples:
- Exceeded planned risk
- Moved stop loss farther away
- Entered without a valid setup
- Overtraded
- Traded outside the planned session
- Added to a losing position
- Ignored a daily stop rule
A profitable day with a serious rule violation should not automatically be considered a successful process day.
15. Emotional State
Add a short emotional rating before and after the trade.
You can use a simple 1–5 scale for confidence, stress, fear, impatience or frustration.
Do not turn this into a complicated psychology project. The objective is to identify repeatable relationships between emotional states and trading mistakes.
16. Mistake Rate
Separate strategy losses from execution or discipline mistakes.
A valid setup that reaches its stop according to your plan is different from an impulsive trade taken outside your system.
Track the percentage of trades containing a preventable mistake. This can become one of your most actionable performance metrics.
17. Daily and Weekly P&L
Record daily and weekly net results, but do not stop at the dollar figure.
For each day, also record:
- Net P&L
- Number of trades
- Average risk
- Largest loss
- Largest win
- Rule violations
- Market conditions
- Quality of execution
This gives you a process-based view of performance instead of simply labeling a day as green or red.
A Simple Prop Firm Trading Journal Template
| Metric | What to Record |
|---|---|
| Trade | Instrument, date and time |
| Setup | Strategy or entry model |
| Direction | Long or short |
| Entry/Exit | Planned and actual prices |
| Risk | Dollar risk and R |
| Result | P&L and realized R |
| Execution | Slippage, spread and fill quality |
| Time | Session and holding duration |
| Psychology | Emotional state |
| Mistake | Yes/no plus explanation |
| Screenshot | Before and after trade chart |
| Lesson | One actionable takeaway |
How Often Should You Review Your Journal?
A practical system is to review trades at three levels.
After Every Trading Session
Record trades, screenshots, mistakes and emotional state while the details are still fresh.
Weekly
Review setup performance, risk, drawdown, rule violations, losing streaks and execution quality.
Monthly
Compare your statistics with previous months. Look for changes in expectancy, profit factor, drawdown, average risk and mistake rate.
Metrics That Matter Most for Prop Traders
If you want a minimal journal, start with these ten:
- Net P&L
- Win rate
- Average win
- Average loss
- Expectancy
- Profit factor
- Maximum drawdown
- Risk per trade
- Rule violations
- Setup performance
Then add execution, psychology and session metrics as your dataset grows.
Common Trading Journal Mistakes
- Tracking too many metrics: A complicated journal may stop you from maintaining it consistently.
- Tracking only P&L: Money alone does not explain why performance changed.
- Not tagging setups: Without setup labels, it becomes difficult to identify which trades are actually working.
- Ignoring rule violations: A profitable violation can still be a process failure.
- Reviewing too early: Avoid drawing major conclusions from a tiny sample size.
- Changing the system after every losing streak: Separate normal variance from a genuine process problem.
Final Takeaway
A prop firm trading journal should function as a risk-management and decision-review system, not simply a diary of wins and losses.
Track the metrics that explain your complete trading process: risk, drawdown, expectancy, setup performance, execution, holding time, rule compliance and mistakes. Over time, the journal can show whether your results are coming from a repeatable process or from inconsistent decisions.
The most useful journal is the one you can maintain consistently and review objectively. Start with a small set of high-value metrics, build a meaningful sample of trades, and then expand your analysis based on the questions your own data raises.