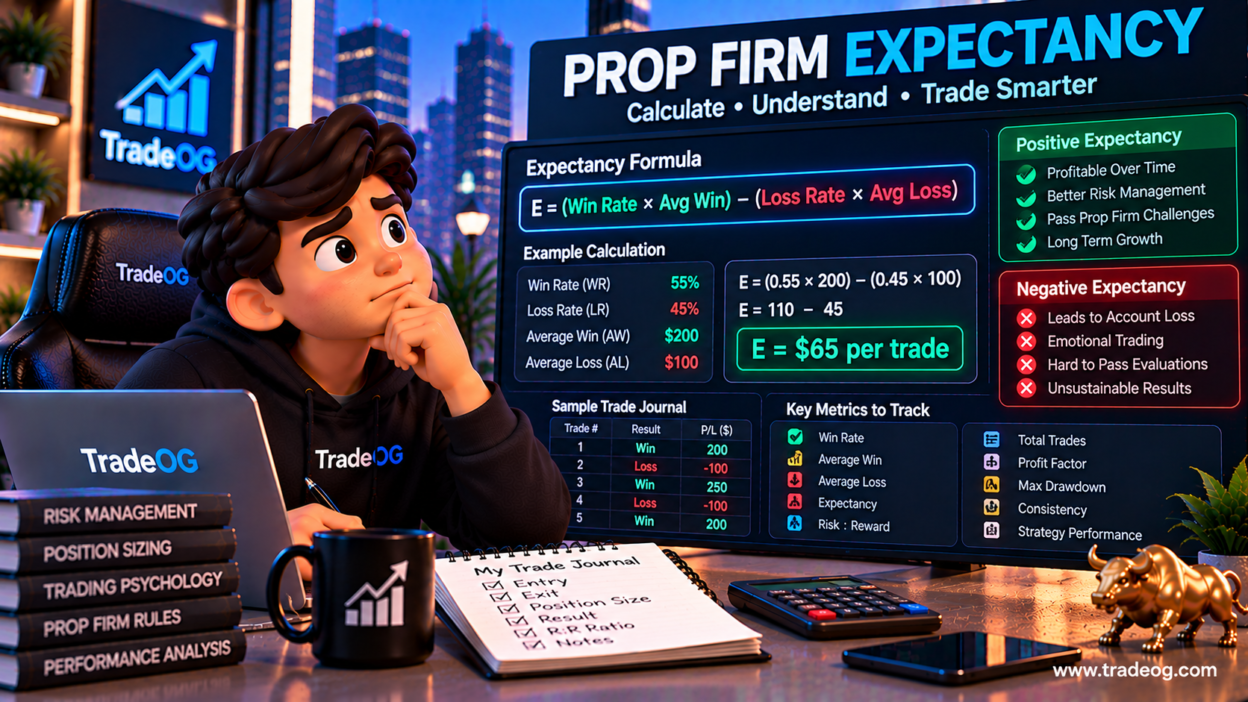
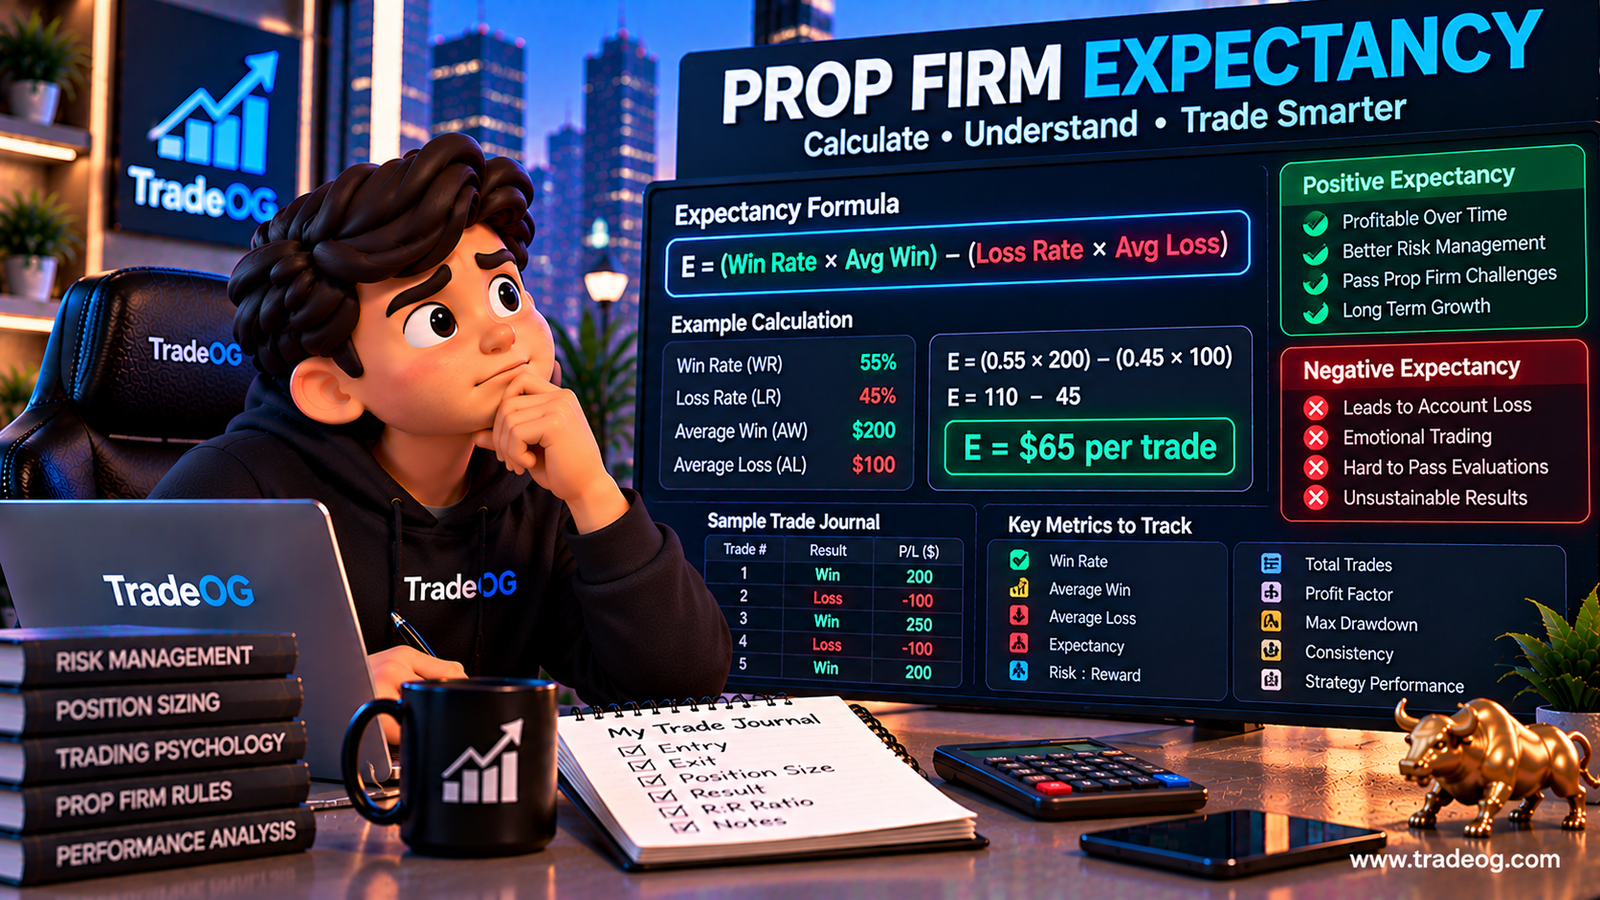
If you trade with a prop firm, knowing your trading expectancy can tell you much more than your win rate alone. Expectancy combines how often you win with how much you make when you win and how much you lose when you lose.
For a prop trader, this is especially useful because account rules create a limited risk budget. A strategy can have a high win rate and still lose money if its losing trades are much larger than its winners. Conversely, a strategy can have a relatively low win rate and still produce positive historical expectancy when its winners are sufficiently larger than its losses.
This guide explains the expectancy formula, how to calculate it from your trade journal, how to calculate expectancy in R, how commissions and slippage affect the number, and how to use the result without treating it as a guarantee of future performance.
What Is Trading Expectancy?
Trading expectancy is the average profit or loss per trade implied by a defined sample of trades.
The standard formula is:
Expectancy = (Win Rate × Average Win) − (Loss Rate × Average Loss)
CME Group describes a similar mathematical expectation model using the frequency of winning trades, average winning size, frequency of losing trades and average losing size. CME Group — The Mathematics of Trading Success
The result can be expressed in dollars, rupees, points, or an R-multiple depending on how you structure your journal.
Why Expectancy Matters for Prop Firm Traders
Prop firm traders usually operate within predefined account limits. That means the question is not simply whether a strategy wins frequently. You also need to understand how much the strategy tends to make or lose per trade and how those results interact with your available drawdown.
Expectancy helps combine these variables into one historical performance measure.
For example, consider two hypothetical systems:
- System A wins 70% of trades but averages $50 on winners and $150 on losers.
- System B wins 45% of trades but averages $250 on winners and $100 on losers.
System A has the higher win rate, but its expectancy is:
(0.70 × $50) − (0.30 × $150) = $35 − $45 = −$10
System B has:
(0.45 × $250) − (0.55 × $100) = $112.50 − $55 = +$57.50
These are hypothetical examples, but they show why win rate alone does not describe the mathematical characteristics of a trading method.
The Four Inputs You Need
To calculate basic expectancy, collect four numbers from your closed trades.
1. Win Rate
Win rate is the number of winning trades divided by total closed trades.
Win Rate = Winning Trades ÷ Total Trades
If you have 55 winning trades out of 100 closed trades:
55 ÷ 100 = 55%
2. Loss Rate
If your dataset contains only winning, losing and breakeven trades, loss rate is the proportion of losing trades. Do not simply assume it is always 100% minus win rate if your journal contains a meaningful number of breakeven trades; include those trades in the total and account for their zero result.
3. Average Win
Add the net results of all winning trades and divide by the number of winning trades.
Average Win = Total Profit From Winners ÷ Number of Winners
4. Average Loss
Add the absolute losses from losing trades and divide by the number of losing trades.
Average Loss = Total Loss From Losers ÷ Number of Losers
For a useful journal, use final trade results after the costs that you want your expectancy measurement to represent.
How to Calculate Prop Firm Expectancy Step by Step
Step 1: Collect a Trade Sample
Export your closed trades from your platform or trading journal. Include the entry date, instrument, direction, quantity, entry, exit and final P&L.
Do not calculate expectancy from one or two trades. A tiny sample can produce a number that changes dramatically with the next trade.
Step 2: Separate Winners and Losers
Suppose your sample contains 100 closed trades:
- 55 winning trades
- 40 losing trades
- 5 breakeven trades
Your win rate is 55% and your loss rate is 40%. The five breakeven trades contribute zero to the expectancy calculation but remain part of the total trade sample.
Step 3: Calculate Average Win
Suppose the 55 winners generated a combined net profit of $11,000.
Average Win = $11,000 ÷ 55 = $200
Step 4: Calculate Average Loss
Suppose the 40 losing trades produced a combined loss of $4,000.
Average Loss = $4,000 ÷ 40 = $100
Step 5: Apply the Formula
Now calculate:
Expectancy = (0.55 × $200) − (0.40 × $100)
Expectancy = $110 − $40 = +$70 per trade
For this historical sample, the average trade result is $70 after the costs included in the trade results.
Expectancy as an R-Multiple
Dollar expectancy is useful, but R expectancy can make comparisons easier when your position size changes.
Here, 1R represents the amount you planned to risk on a trade.
- +2R means the trade made twice the planned risk.
- +1R means the trade made one unit of planned risk.
- -1R means the trade lost one unit of planned risk.
For example, imagine five trades produce:
| Trade | Result |
|---|---|
| 1 | +2R |
| 2 | -1R |
| 3 | +1R |
| 4 | -1R |
| 5 | +2R |
Total = +3R.
R Expectancy = +3R ÷ 5 = +0.60R per trade
R-based expectancy is particularly useful when comparing trades with different contract sizes or different dollar risk.
Expectancy and Prop Firm Drawdown
A positive expectancy does not mean that your account cannot experience a losing streak.
This distinction is critical for prop trading. A strategy may have positive historical expectancy while still producing several consecutive losses. CME Group’s risk-management material illustrates how a sequence of losses can materially reduce an account and increase the recovery required afterward. CME Group — Controlling Risk
For that reason, compare expectancy with:
- Maximum drawdown
- Largest losing streak
- Average risk per trade
- Daily loss limit
- Maximum loss limit
- Remaining drawdown buffer
Expectancy tells you about average trade performance. It does not tell you exactly when the next winning or losing trade will occur.
Do Trading Costs Belong in Expectancy?
They should be treated consistently.
If your goal is to know what your strategy actually produced in the account, calculate expectancy from net trade results after applicable commissions, fees and execution costs.
If you calculate expectancy before costs, label it clearly as gross expectancy and then separately estimate the effect of trading costs.
Consistency is more important than using two different cost treatments across different periods.
Expectancy vs Win Rate
Win rate answers:
“How often do I win?”
Expectancy answers a broader question:
“What has each trade been worth on average in this sample?”
A high win rate can coexist with negative expectancy. A lower win rate can coexist with positive expectancy when average winning trades are sufficiently larger than average losing trades.
This is why evaluating your trading system using only win percentage can hide important information.
Expectancy vs Profit Factor
These metrics are related but different.
Profit factor = Gross Profit ÷ Gross Loss
Expectancy measures average result per trade. Profit factor compares total gains with total losses.
For example, a trader can have a positive expectancy while still needing to understand how much capital and how many trades were required to generate that result.
Use both metrics together with trade count, drawdown and risk.
Calculate Expectancy by Setup
Do not stop at one overall expectancy number.
Tag every trade by setup and calculate expectancy separately for each setup once you have enough observations.
Useful breakdowns include:
- Breakout expectancy
- Pullback expectancy
- Trend-continuation expectancy
- Reversal expectancy
- News-session expectancy
- London-session expectancy
- New York-session expectancy
Your overall number can hide substantial differences between setups. A strategy may have positive aggregate expectancy because one setup performs strongly while another consistently drags the results down.
Calculate Expectancy by Instrument
If you trade multiple futures markets, separate the data by instrument.
For example, keep individual statistics for ES, MES, NQ and MNQ rather than combining every trade immediately.
Track:
- Number of trades
- Win rate
- Average win
- Average loss
- Expectancy
- Profit factor
- Maximum drawdown
This can show whether your process behaves differently across instruments with different volatility and contract specifications.
What a Negative Expectancy Means
If your measured expectancy is negative, the historical sample produced a negative average result per trade.
That does not automatically tell you which component needs to change. Investigate the underlying numbers.
Possible areas to examine include:
- Win rate
- Average winner
- Average loser
- Position sizing
- Trade selection
- Execution costs
- Slippage
- Rule violations
For example, if your win rate remains stable but average losses increase, the issue may be risk management rather than entry accuracy.
How to Improve the Usefulness of Your Expectancy Data
Use a Consistent Sample
Do not switch between gross and net P&L from one month to another. Use the same calculation method throughout the dataset.
Track Enough Trades
A small sample can be heavily influenced by a few unusually large winners or losers. Treat early results as provisional rather than conclusive.
Track Outliers
Record your largest winning and losing trades. One exceptional trade can materially change the average.
Separate Strategy From Discipline
Tag trades that followed your plan and trades that violated it. A negative result from a valid setup is different from a loss caused by ignoring your own rules.
Review Expectancy Over Time
Calculate it monthly or over rolling trade samples. A single lifetime number can hide deterioration or improvement in recent performance.
A Simple Prop Firm Expectancy Spreadsheet
| Column | Example |
|---|---|
| Date | 03 Oct 2026 |
| Instrument | MNQ |
| Setup | Pullback |
| Planned Risk | $100 |
| Net P&L | +$200 |
| R Result | +2R |
| Rule Violation | No |
| Session | New York |
At the end of the review period, calculate total trades, winning trades, losing trades, breakeven trades, average win, average loss, expectancy, profit factor, maximum drawdown and largest losing streak.
Common Expectancy Calculation Mistakes
- Using win rate alone: Win percentage does not include the size of winners and losers.
- Ignoring breakeven trades: A zero-result trade still belongs in the total sample.
- Mixing gross and net results: This can make comparisons misleading.
- Using unrealized P&L: Keep the dataset based on a clearly defined closed-trade methodology.
- Changing the risk definition: If you calculate R, define 1R consistently.
- Overreacting to a short sample: A handful of trades cannot establish a stable long-term edge.
- Ignoring drawdown: Positive expectancy does not eliminate losing streaks.
Frequently Asked Questions
What is a good prop firm expectancy?
There is no universal number that can be called “good” without considering the strategy, risk unit, trading costs, drawdown structure, sample size and trading objectives. Focus first on calculating your own expectancy consistently.
Can a trader have positive expectancy with a low win rate?
Yes. If average winning trades are sufficiently larger than average losing trades, a lower win rate can still produce positive historical expectancy. CME Group provides a mathematical example showing how a model can have positive expectation despite winning less than half of its trades. CME Group — The Mathematics of Trading Success
Should expectancy be calculated in dollars or R?
Both can be useful. Dollar expectancy shows average monetary performance, while R expectancy normalizes results around planned trade risk.
How many trades should I use?
There is no single universal minimum. The important point is that the sample should be large enough to reduce the influence of a few unusual outcomes, and you should continue monitoring expectancy as new trades are added.
Final Takeaway
Calculating prop firm expectancy is straightforward:
Expectancy = (Win Rate × Average Win) − (Loss Rate × Average Loss)
But the useful part is not the formula alone. Build the calculation from consistent closed-trade data, include relevant trading costs, calculate expectancy in both currency and R when useful, and break it down by setup, instrument and session.
Then compare expectancy with drawdown, losing streaks, position size and prop firm risk limits. A positive historical expectancy describes the average behavior of a sample; it does not guarantee that future trades will be profitable or that a prop firm account will avoid a drawdown.
For a broader framework, review CME Group’s mathematics of trading success and use your own journal data to calculate the statistics that matter to your trading process.