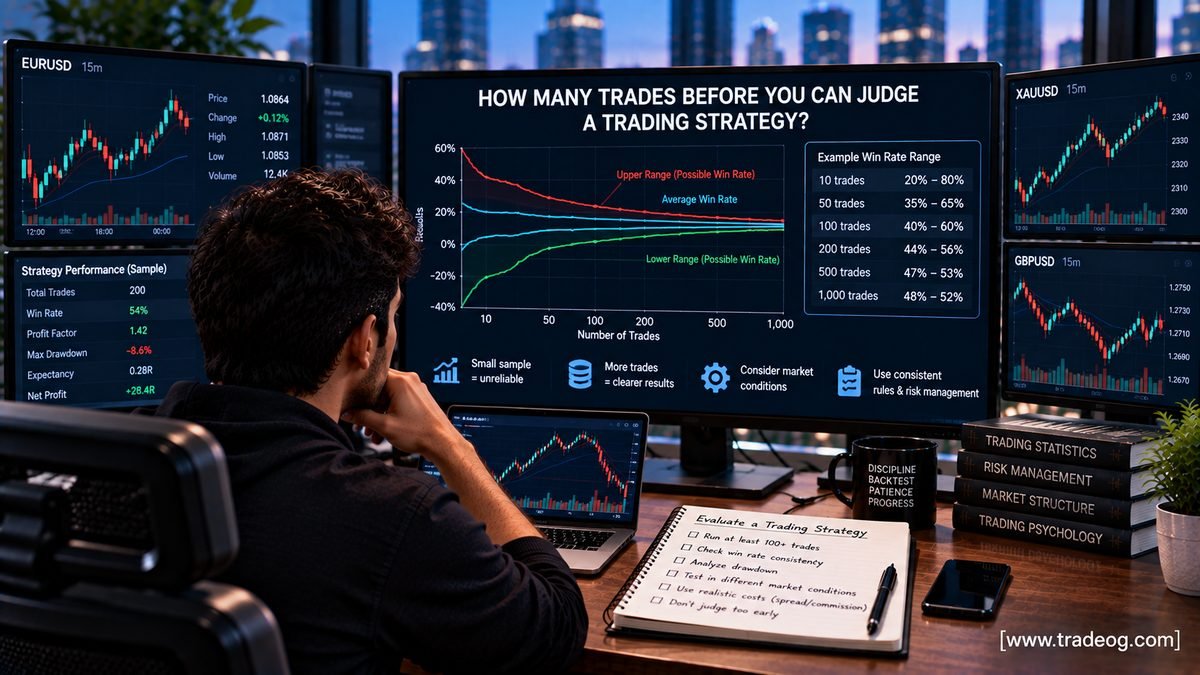
One of the most common mistakes in strategy testing is judging a trading system too early. A trader may see 10 winning trades and assume the strategy works, or experience 15 losses and decide that the system is useless.
Neither conclusion is necessarily justified.
There is no universal number of trades that proves a trading strategy works. The right sample size depends on the strategy’s win rate, payoff distribution, volatility, timeframe, number of parameters, market conditions and the level of statistical confidence you want.
However, there are practical ways to determine whether you have enough data to make a meaningful evaluation. The key is to stop asking only, “How many trades?” and start asking, “How much evidence do I have that the observed performance is more than random variation?”
Why 10 or 20 Trades Are Usually Not Enough
Small samples are extremely noisy.
Imagine a strategy whose true long-term win probability is 55%. Over only 10 trades, almost any result is possible. The strategy could win 8 trades, 5 trades or even 2 trades without proving that its underlying edge has changed.
This is the basic problem with small samples: the observed win rate can be very different from the underlying win probability.
For example, a trader records:
- 8 wins out of 10 trades = 80% observed win rate
- 55 wins out of 100 trades = 55% observed win rate
- 550 wins out of 1,000 trades = 55% observed win rate
The first result looks dramatically better, but it contains far less information.
There Is No Magic “100 Trade Rule”
You will often hear traders say that a strategy needs 100 trades before it can be judged.
One hundred trades can be a useful practical checkpoint, but it is not a statistical law.
A strategy that takes 20 trades per year may need several years of observations to capture different market conditions. A high-frequency strategy may generate thousands of trades in a relatively short period, but those trades may not be independent because they can be exposed to the same market regime.
Therefore, 100 trades from a single market condition are not necessarily more informative than 50 trades distributed across several meaningful conditions.
What Determines the Required Number of Trades?
1. Win Rate
The closer a strategy’s true win probability is to 50%, the more observations are generally needed to distinguish a genuine edge from random variation.
A strategy that wins 52% of trades has a relatively small statistical edge over a strategy that wins 50%. Detecting that difference reliably requires substantially more evidence than evaluating a strategy with a much larger expected edge.
2. Risk-to-Reward Ratio
Win rate becomes less informative when winners and losers have very different sizes.
A strategy can win only 40% of trades and still be profitable if its average winner is sufficiently larger than its average loss. In that situation, you need enough trades to estimate the distribution of wins and losses, not simply the percentage of winning trades.
This connects directly with our article Why Can a High Win Rate Strategy Still Lose Money?.
3. Trade Frequency
A strategy that produces 500 trades per year can accumulate statistical evidence faster than a strategy that produces 20 trades per year, but only if those trades provide genuinely useful information.
High-frequency trades can be highly correlated during the same market event. Ten trades taken during one five-minute volatility burst should not automatically be treated as ten completely independent pieces of evidence.
4. Market Regimes
A strategy needs exposure to the conditions in which it is intended to operate.
For example, a trend-following system should ideally be evaluated across strong trends, sideways markets, changing volatility and periods when trends fail.
Our guide on why trading strategies stop working during different market conditions explains why a strategy’s performance can change when the underlying market regime changes.
5. Strategy Complexity
The more parameters and rules you optimize, the more evidence you generally need.
A simple rule such as “buy when condition A occurs and risk 1R” is easier to evaluate than a system containing dozens of adjustable indicators, session filters, volatility thresholds and exit conditions.
This also connects with backtest overfitting. A complex strategy can look excellent on a limited sample simply because it has been adjusted to fit historical noise.
Think in Terms of Confidence, Not a Fixed Trade Count
Suppose a strategy wins 60 of its first 100 trades. That is a 60% observed win rate.
It does not mean the strategy’s true win rate is exactly 60%.
There is uncertainty around every estimate derived from a finite sample. A confidence interval gives you a way to describe that uncertainty.
For a simple binomial model, the estimated standard error of a proportion can be approximated by:
SE = √[p(1 − p) / n]
where:
- p = observed win rate
- n = number of trades
As n increases, the uncertainty around the estimated win rate generally decreases.
This is why a 60% win rate from 20 trades tells you much less than a 60% win rate from 1,000 trades.
Example: 60% Win Rate With Different Sample Sizes
| Trades | Observed Wins | Observed Win Rate | Reliability |
|---|---|---|---|
| 20 | 12 | 60% | Very noisy |
| 50 | 30 | 60% | Still uncertain |
| 100 | 60 | 60% | Useful checkpoint |
| 250 | 150 | 60% | Stronger evidence |
| 500 | 300 | 60% | Much more informative |
| 1,000 | 600 | 60% | Still not a guarantee |
These labels are practical rather than mathematical guarantees. Even 1,000 trades do not prove that the next 1,000 trades will behave the same way.
Why 100 Trades Can Still Be Misleading
Consider two strategies that each have 100 trades.
Strategy A takes one trade every few days and therefore spans two years.
Strategy B takes 100 trades during a single highly volatile month.
Both have the same trade count, but the evidence is not equivalent.
Strategy A may have encountered multiple market environments. Strategy B may have effectively tested one regime.
This is why calendar coverage matters alongside trade count.
Look at the Number of Market Regimes Covered
Instead of asking only how many trades occurred, identify what those trades actually represent.
A useful testing period may include:
- strong trends
- sideways markets
- high volatility
- low volatility
- major economic news
- quiet sessions
- rapid reversals
- different liquidity conditions
If all of your trades occurred during one unusually favourable environment, the strategy has not been tested broadly enough.
Trade Count vs Independent Observations
This distinction is particularly important for automated and high-frequency strategies.
Suppose an algorithm takes 30 trades during a single market shock. Those 30 trades may be strongly related because they were generated by the same underlying event.
Counting them as 30 completely independent observations can exaggerate how much information the sample contains.
The same issue can appear with multiple correlated instruments. A long EUR/USD trade, short USD/CHF trade and long GBP/USD trade may all be influenced by the same dollar movement.
Therefore, a robust evaluation should consider dependence and clustering, not only raw trade count.
How Many Trades Should You Use for a Backtest?
For practical strategy development, a useful approach is to build a sample large enough to cover multiple market conditions rather than selecting a universal number.
As a rough workflow:
- Under 30 trades: usually too little evidence for a serious performance conclusion.
- 30–100 trades: useful for identifying obvious problems, but still highly uncertain.
- 100–300 trades: a much more useful research sample for many discretionary or medium-frequency strategies.
- 300–1,000+ trades: increasingly informative when the trades cover diverse market conditions and the strategy rules remain consistent.
These are practical ranges, not guarantees. A strategy with rare setups may require a longer calendar period, while a high-frequency strategy may need a different statistical framework.
Do Not Stop at the Backtest
Even a large historical sample can be misleading if the strategy has been optimized heavily on that same data.
A better process separates:
- Development data — used to create the strategy.
- Validation data — used to test the finalized strategy.
- Forward or live data — used to see how it behaves under real conditions.
The validation sample should not be repeatedly used to improve the strategy. Otherwise, it gradually becomes another development dataset.
Walk-Forward Testing Adds Another Layer
Walk-forward testing can help answer a more realistic question: “If I had only known what was available at that time, would the strategy have continued to work?”
A typical process is:
- Develop the strategy using an earlier period.
- Freeze the rules.
- Test on the next unseen period.
- Move forward through history.
- Repeat.
- Evaluate the combined out-of-sample performance.
This helps reveal strategies that look strong in one historical block but fail when conditions change.
How Many Trades Do You Need to Judge Win Rate?
If your main question is simply whether the observed win rate is stable, sample size calculations can be useful.
For example, if a strategy has a true win probability around 50%, the observed percentage can move substantially over a small number of trades. With more observations, the estimate tends to become more precise.
But precision around win rate is not the same as proof of profitability.
A strategy could have a very precisely estimated 52% win rate and still lose money after commissions, spread, slippage and large losing trades.
You therefore need to estimate expectancy, not only win probability.
Expectancy Needs Its Own Sample
Expectancy is usually calculated as:
Expectancy = (Win Rate × Average Win) − (Loss Rate × Average Loss)
Imagine two strategies:
- Strategy A: 60% wins, average win 1R, average loss 1R.
- Strategy B: 45% wins, average win 2R, average loss 1R.
Both can have positive expectancy.
But the distribution of returns is different, and you need enough trades to estimate not only how often trades win, but also how large winners and losers tend to be.
Why the Biggest Trades Matter So Much
Some strategies have highly skewed returns. One large winner may contribute a substantial percentage of total profit.
This can create the opposite problem from a high-win-rate system.
A strategy might look unprofitable for 100 trades and then make most of its annual return from one exceptional trend.
If you judge it before that type of opportunity appears, you could incorrectly reject a strategy that actually has a positive long-term expectancy.
This is another reason why the right sample size depends on the strategy’s payoff distribution.
What Metrics Should You Track?
When evaluating a strategy, record more than the total number of trades.
| Metric | Why It Matters |
|---|---|
| Win rate | Shows how frequently trades close profitably |
| Average win | Measures typical winning-trade size |
| Average loss | Measures typical losing-trade size |
| Expectancy | Estimates average result per trade |
| Profit factor | Compares gross profits with gross losses |
| Maximum drawdown | Shows historical peak-to-trough loss |
| Largest loss | Shows tail-risk exposure |
| Longest losing streak | Tests psychological and financial tolerance |
| Monthly/yearly returns | Shows consistency across time |
| Out-of-sample results | Tests performance on unseen data |
What About 1,000 Trades?
More trades generally provide more information, but more data cannot fix a flawed research process.
If a strategy is overfitted, 10,000 trades from the same optimized historical dataset can still produce a misleadingly attractive backtest.
Similarly, 1,000 highly correlated trades generated during one market regime do not necessarily represent 1,000 independent observations.
The quality, diversity and independence of the observations matter.
When Should You Stop Testing?
You should not keep testing indefinitely until the results look attractive.
That creates a serious risk of data mining and backtest overfitting.
A sensible stopping framework is to define your testing rules before analyzing the final results:
- what markets will be tested?
- what timeframe will be used?
- what historical period will be included?
- what costs will be assumed?
- what constitutes acceptable drawdown?
- what sample size is targeted?
- what validation period will remain untouched?
- what conditions would make you reject the strategy?
Predefining these conditions reduces the temptation to keep modifying the strategy until the backtest looks impressive.
A Practical Testing Framework
For a discretionary or systematic strategy, you can use this framework:
Phase 1 — Initial Test
Collect enough trades to identify obvious weaknesses. Do not make major conclusions from a very small sample.
Phase 2 — Broad Historical Test
Expand the sample across different years and market regimes. Track the complete distribution of returns.
Phase 3 — Robustness Testing
Change reasonable assumptions, test nearby parameters and include realistic spreads, commissions and slippage.
Phase 4 — Out-of-Sample Test
Run the finalized rules on data that was not used for development.
Phase 5 — Forward Test
Observe the strategy in current market conditions before committing significant capital.
When Is a Strategy “Proven”?
Strictly speaking, a trading strategy is never proven in the sense of being guaranteed to work in the future.
Markets evolve. Participants change. Liquidity changes. Volatility changes. Transaction costs change. A strategy can have strong historical evidence and still experience future drawdowns.
The objective of testing is therefore not certainty. It is to determine whether the evidence is strong enough to justify the level of risk you are considering.
Final Takeaway
There is no magic number of trades that proves a trading strategy works.
For many strategies, fewer than 30 trades is far too small to make a serious performance judgment. Around 100 trades can be a useful checkpoint, while 300–1,000+ trades can provide much stronger evidence when the sample covers multiple market regimes and the trades are not excessively correlated.
But trade count is only one part of the answer.
A serious evaluation should combine sample size with:
- win rate
- average win and loss
- expectancy
- profit factor
- drawdown
- market-regime coverage
- realistic execution costs
- out-of-sample testing
- forward testing
- robustness against reasonable parameter changes
The goal is not to collect the largest possible number of trades. The goal is to collect enough high-quality evidence to understand how the strategy behaves when the market changes.
Risk disclaimer: This article is for educational and informational purposes only. Backtested and historical results do not guarantee future performance. Trading leveraged financial products involves substantial risk, and losses can be significant. Always evaluate strategy risk independently before committing capital.