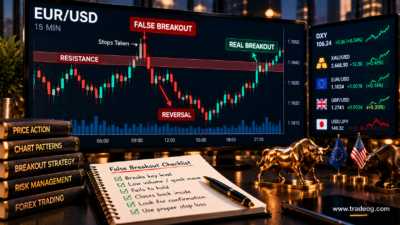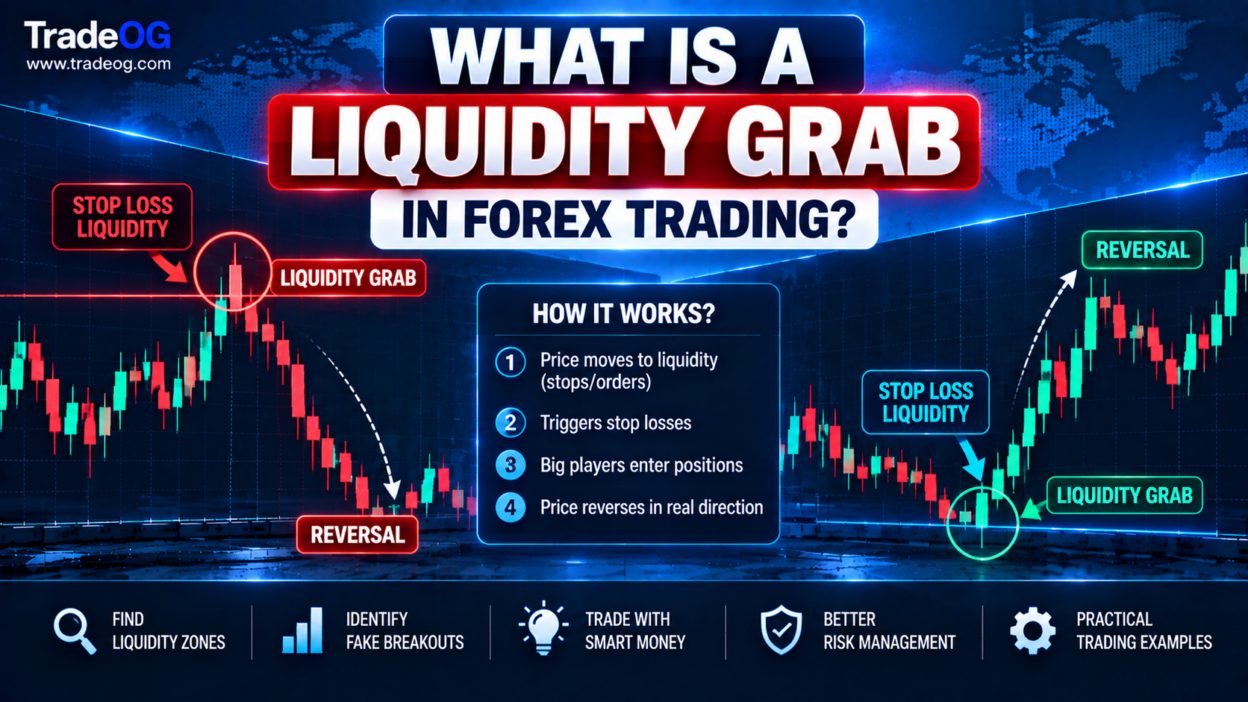
A liquidity grab in forex trading is a price move that briefly pushes through an obvious high or low, interacts with orders concentrated around that level, and then often rejects the breakout area. Traders also use terms such as liquidity sweep, stop sweep or stop hunt, although these terms are not always identical.
The idea matters because many traders place stop-loss orders around recent swing highs and lows, while breakout traders often place entries just beyond those same levels. When price reaches a crowded level, the resulting order flow can create a sharp move through the level. If price then quickly returns inside the prior range, traders may describe the event as a liquidity grab.
However, a liquidity grab is not proof that a broker, bank or institution deliberately hunted your stop. Retail forex is largely an over-the-counter market, liquidity is fragmented across venues, and the exact location of every market participant’s orders is not publicly visible. The useful approach is to treat a liquidity grab as a price-action concept and look for confirmation rather than assuming intent.
What Does Liquidity Mean in Forex?
Liquidity describes how easily an asset can be bought or sold without causing a large price change. Forex is generally a highly liquid market, particularly in major currency pairs, but liquidity changes by pair, trading session, news event and market conditions.
BabyPips’ liquidity explanation notes that liquidity affects execution, spreads and the ease with which buyers and sellers can transact. Liquidity is dynamic rather than fixed.
For a trader, the practical question is therefore not simply “Where is liquidity?” but:
- Where are many traders likely to have orders?
- Which highs and lows are obvious on the chart?
- Where might stop-loss orders be clustered?
- Where might breakout traders place stop entries?
- Is the market liquid enough for the move to be meaningful?
What Is a Liquidity Grab?
A liquidity grab is a short-term price excursion beyond a visible level where orders are likely concentrated, followed by rejection or a change in direction.
A simple example:
- EUR/USD forms a clear swing high at 1.1000.
- Several traders identify 1.1000 as resistance.
- Short sellers place protective stops above the high.
- Breakout traders place buy-stop entries above 1.1000.
- Price rallies through 1.1000.
- The orders around the level are triggered.
- Price fails to hold above the high and falls back below 1.1000.
That final rejection is what makes the move interesting from a price-action perspective. If price simply breaks 1.1000 and continues higher, it may be a genuine breakout rather than a liquidity grab.
Liquidity Grab vs Liquidity Sweep vs Stop Hunt
| Term | Common meaning | Important caveat |
|---|---|---|
| Liquidity grab | Price takes an obvious level and then often rejects it | Needs confirmation; not every level break is a grab |
| Liquidity sweep | Price trades through a known liquidity area or multiple highs/lows | Can lead to either reversal or continuation |
| Stop hunt | Informal term for a move believed to trigger clustered stops | Does not prove deliberate manipulation |
| False breakout | Price breaks a technical level but fails to sustain the move | Can occur without a specific liquidity event |
These expressions overlap in trading communities, so definitions vary. The safest habit is to describe what price actually did rather than assigning an institutional motive that cannot be verified from a retail chart.
Where Do Liquidity Grabs Usually Happen?
Liquidity tends to become more interesting around levels that many traders can see. The more obvious the level, the more likely it is to attract attention.
1. Previous swing highs
A visible swing high can attract short entries, stop-loss orders from existing sellers and breakout buy orders. A quick move above the high followed by rejection is a classic bearish liquidity-grab setup.
2. Previous swing lows
The opposite happens below a swing low. Sell stops from long positions and breakout sell orders can become active when price pushes below the low.
3. Equal highs
Two or more similar highs can create an especially obvious reference level. Traders often describe the area above those highs as buy-side liquidity.
4. Equal lows
Repeated lows can create a visible pool of sell-side interest below the market. A brief sweep below the lows followed by recovery can become a bullish reversal setup if other evidence supports it.
5. Previous-day high and low
Daily extremes are widely watched. A move through the previous day’s high or low can therefore attract significant attention, especially during active London or New York trading hours.
6. Session highs and lows
Asian, London and New York session levels can become important intraday references. For gold and major forex pairs, traders often monitor the Asian range before London or New York becomes active.
See Gold Trading Sessions in IST: When Is XAU/USD Most Active? for a practical session framework.
Buy-Side and Sell-Side Liquidity
Two common labels are buy-side liquidity and sell-side liquidity.
Buy-side liquidity
Buy-side liquidity is commonly discussed above obvious highs. A trader holding a short position may have a buy stop above the high, while a breakout trader may also have a buy-stop entry above the same level.
A move above the high can therefore activate buying orders. If price then rejects the area and falls, traders may call it a buy-side liquidity grab.
Sell-side liquidity
Sell-side liquidity is commonly discussed below obvious lows. Long positions may have sell stops below the low, while breakout traders can have sell-stop entries there as well.
A quick move below the low followed by a recovery can therefore be described as a sell-side liquidity grab.
How a Liquidity Grab Works: Step by Step
Consider a bullish example.
Step 1: A clear low forms
GBP/USD drops to 1.2500 and creates a visible swing low. Price then rallies.
Step 2: Traders identify the level
Long traders may place protective stops below 1.2500. Other traders may plan a bearish breakout if the low breaks.
Step 3: Price returns to the low
Later, price falls back toward 1.2500. The market is now approaching a level with obvious technical significance.
Step 4: Price trades below the low
GBP/USD briefly prints 1.2485. The low has been swept.
Step 5: Price rejects the lower prices
Instead of continuing lower, the market quickly recovers above 1.2500.
Step 6: Confirmation appears
A trader might wait for a bullish candle close, a break of a short-term swing high or another defined confirmation before considering a long setup.
The important part is that the sweep itself is not the trade signal. The rejection and subsequent structure provide the information that may make the setup actionable.
Liquidity Grab vs Genuine Breakout
This is one of the most important distinctions for traders.
| Feature | Potential liquidity grab | Potential genuine breakout |
|---|---|---|
| Price crosses level | Yes | Yes |
| Candle closes beyond level | Often weak or quickly rejected | Often holds beyond level |
| Follow-through | Limited or reverses | Continues in breakout direction |
| Retest | Can reclaim the old range | May hold the broken level as support/resistance |
| Trade idea | Wait for rejection/confirmation | Wait for acceptance/confirmation |
There is no single candle pattern that guarantees the difference. Context matters more than the label.
Why Traders Get Trapped by Liquidity Grabs
Liquidity grabs exploit a common weakness in technical trading: placing decisions exactly where everyone else can see the same level.
Suppose thousands of traders watch the same resistance. Some short below it. Others buy the breakout above it. Both groups can be correct about the level but wrong about what happens immediately after price touches it.
This creates a sequence that often looks like:
Obvious level → breakout entry → stop activation → rejection → reversal.
The lesson is not to stop using stop-losses. Stops are an important risk-management tool. Instead, traders should understand that a stop placed at an extremely obvious level can be vulnerable to short-term volatility.
BabyPips explains that stop orders can experience slippage during sharp market moves and can be triggered by temporary price swings.
How to Identify a Liquidity Grab on a Chart
A practical identification process can be kept simple.
- Find an obvious level. Look for a clear swing high, swing low, equal highs/lows or session extreme.
- Mark the liquidity area. Treat it as an area rather than an exact pip.
- Watch the approach. Is price accelerating into the level or consolidating?
- Observe the sweep. Does price actually trade beyond the level?
- Wait for rejection. Does price return inside the prior range?
- Look for structure confirmation. Has a short-term high/low broken in the reversal direction?
- Check the broader context. Trend, session, news and higher-timeframe levels still matter.
Liquidity Grabs During London and New York
Session timing can matter because liquidity conditions and participation change throughout the day.
London often creates strong intraday expansion after the Asian session. New York can then either continue the move or reverse it when U.S. economic information enters the market.
This is particularly relevant around the London-New York overlap. A trader may see price take the London high, reject it and reverse, or break the high and continue with strong acceptance.
For a deeper New York framework, read XAU/USD New York Session Behavior Explained.
Liquidity Grabs Around Economic News
News can create liquidity-grab-like price action, but traders should be careful with the interpretation.
Before CPI, NFP, FOMC or another major release, the market may trade around obvious levels. When the data arrives, price can move sharply through a high or low. If the initial reaction is reversed, the chart may look like a liquidity grab.
But news moves can also produce genuine repricing. A reversal after a data spike does not automatically mean that someone “hunted stops.”
For Indian traders, always check the economic calendar before trading a technical liquidity setup. You can use the TradeOG Forex Economic Calendar guide to build that routine.
Liquidity Grab Trading Strategy: A Simple Framework
Instead of entering immediately when a high or low is swept, use a confirmation-based framework.
Step 1: Establish the higher-timeframe context
Identify whether the market is trending, ranging or transitioning. A liquidity sweep against a strong higher-timeframe trend should not automatically be treated as a reversal.
Step 2: Mark the obvious liquidity
Use swing highs, swing lows, equal highs, equal lows, session extremes and previous-day levels.
Step 3: Wait for the sweep
Let price actually reach the level. Do not predict the sweep too early.
Step 4: Demand rejection
Look for price to return inside the previous range or reclaim the swept level.
Step 5: Wait for confirmation
Possible confirmations include a break of short-term structure, a strong rejection candle or a failed retest. The exact trigger should be tested on historical data rather than assumed to work universally.
Step 6: Define the invalidation point
If price continues to hold beyond the liquidity level and develops genuine acceptance, the reversal thesis may be invalid.
Step 7: Size the trade from risk
Calculate position size from the distance to the invalidation level and your maximum account risk. Do not choose position size first and then force the stop into a convenient location.
Example: Bullish Liquidity Grab
Imagine EUR/USD has a clear low at 1.0800.
| Event | Price action |
|---|---|
| Range forms | EUR/USD repeatedly holds 1.0800 |
| Liquidity builds | Traders focus on the visible low |
| Sweep | Price drops to 1.0788 |
| Rejection | Price quickly returns above 1.0800 |
| Confirmation | Short-term resistance breaks higher |
| Invalidation | Price accepts below the swept low |
The example is illustrative, not a guaranteed trading setup. A trader should test the complete rule set across different market conditions before risking capital.
Example: Bearish Liquidity Grab
Suppose GBP/USD has repeatedly failed near 1.3000.
- 1.3000 becomes an obvious swing high.
- Short sellers place stops above the high.
- Breakout traders prepare buy stops above 1.3000.
- Price spikes to 1.3020.
- The breakout fails.
- Price closes back below 1.3000.
- A short-term bearish structure break provides additional confirmation.
Again, the important evidence is not simply that the high was taken. It is the combination of level + sweep + rejection + confirmation.
Common Liquidity Grab Mistakes
1. Calling every wick a liquidity grab
A long wick is not enough. Markets naturally create wicks because prices fluctuate and orders execute at different levels.
2. Assuming institutions are hunting retail stops
You cannot infer institutional intent from a single candlestick. Use observable price behavior instead.
3. Entering before confirmation
Price can sweep a low and continue falling. A sweep does not guarantee reversal.
4. Ignoring the higher-timeframe trend
A small sweep on a five-minute chart may be irrelevant against a strong daily trend.
5. Trading directly into major news
News can create rapid price changes, spread expansion and slippage. A technical pattern may not behave normally.
6. Placing stops at arbitrary distances
A stop should be based on the trade’s invalidation and acceptable risk, not simply placed a few pips beyond a visible level.
Liquidity Grab and Risk Management
Risk management is more important than the pattern name.
CME Group’s educational material emphasizes that stop placement should be connected to price action and the trader’s risk profile. At the same time, stop orders are not guaranteed to fill at the exact stop price during fast markets.
That means a liquidity-grab strategy should account for:
- Position size
- Stop distance
- Spread
- Slippage
- News risk
- Trading session
- Account drawdown limits
- Broker execution conditions
For prop-firm traders, this becomes even more important because a single fast XAU/USD or GBP/USD move can materially affect daily drawdown.
Liquidity Grab vs Liquidity Void
These concepts should not be confused.
A liquidity grab describes a price interaction with an area where orders are believed to be concentrated, commonly around an obvious high or low.
A liquidity void generally refers to an area where price moves rapidly with relatively little two-way trading or where the market has left a thinly traded zone. The concepts describe different market conditions.
Does a Liquidity Grab Always Reverse?
No.
This is one of the most important points in this article. A liquidity grab is a trading interpretation, not a law of market behavior.
Price can:
- Sweep a high and reverse.
- Sweep a low and reverse.
- Sweep a high and continue higher.
- Sweep a low and continue lower.
- Break a level, consolidate and continue later.
Therefore, traders should define what evidence separates a valid setup from an invalid one before entering.
How to Backtest Liquidity Grab Setups
If you want to trade liquidity grabs systematically, turn the concept into measurable rules.
- Select one market, such as EUR/USD or GBP/USD.
- Select one timeframe.
- Define exactly what qualifies as an obvious high or low.
- Define how far price must trade beyond the level.
- Define what counts as rejection.
- Define the entry trigger.
- Define the stop and target rules.
- Record session and news conditions.
- Test a large enough sample.
- Measure win rate, average win, average loss and expectancy.
Do not change the rules after every losing trade. Otherwise, the backtest becomes a collection of hindsight decisions rather than a testable trading system.
Liquidity Grab Checklist for Forex Traders
| Question | What to check |
|---|---|
| Is there an obvious level? | Recent swing high/low, equal high/low or session extreme |
| Is liquidity likely concentrated there? | Visible level watched by many traders |
| Did price actually sweep it? | Price traded beyond the level |
| Did price reject? | Price returned inside the prior range |
| Is there confirmation? | Structure break, rejection or failed retest |
| What is the higher-timeframe context? | Trend, range or transition |
| Is major news approaching? | CPI, NFP, FOMC and other high-impact events |
| Where is invalidation? | Level that proves the setup wrong |
| Is risk acceptable? | Position size, spread, slippage and drawdown |
Final Takeaway
A liquidity grab is best understood as a price-action event, not a story about someone deliberately hunting your stop. Price moves toward obvious highs and lows because those levels attract trading interest, and a temporary break can activate stops and breakout orders. When price then rejects the level and confirms a reversal, the setup becomes more interesting.
The strongest framework is simple: identify the level → wait for the sweep → look for rejection → demand confirmation → define invalidation → manage risk.
Do not trade every wick. Do not assume every breakout is fake. And do not assume that a liquidity sweep guarantees a reversal. The quality of the setup comes from context, confirmation and disciplined risk management.
FAQs About Liquidity Grabs in Forex
What is a liquidity grab in forex?
A liquidity grab is a short-term move beyond an obvious high or low that interacts with concentrated orders and then often rejects the level. Traders also call similar events liquidity sweeps or stop hunts.
Is a liquidity grab the same as a stop hunt?
They are often used interchangeably by retail traders, but “stop hunt” implies intent that cannot normally be proven from a chart. “Liquidity grab” is a more neutral description of the price behavior.
How do I spot a liquidity grab?
Look for an obvious high or low, a brief move beyond that level, rejection back into the prior range and confirmation from subsequent price structure.
Does every liquidity grab reverse?
No. Price can sweep a level and continue in the same direction. Always wait for confirmation and define an invalidation point.
What time is best for liquidity grabs?
They can occur at any time, but active session transitions and major news events can produce rapid moves around obvious levels. London and New York are particularly important for many major currency pairs.
Can liquidity grabs be used with XAU/USD?
Yes. Gold traders commonly watch previous highs and lows, Asian and London session extremes, previous-day levels and major news levels. XAU/USD can move very quickly, so position sizing and execution risk are critical.
Are liquidity grabs a reliable trading strategy?
The concept alone is not a complete strategy. A trader needs objective entry, confirmation, invalidation, exit and risk rules and should validate them through backtesting and forward testing.
Sources and further reading: BabyPips: Liquidity, BabyPips: Stop Orders, CME Group: Utilizing Stop Orders, and CME Group: FX Futures, Stops and Liquidity.