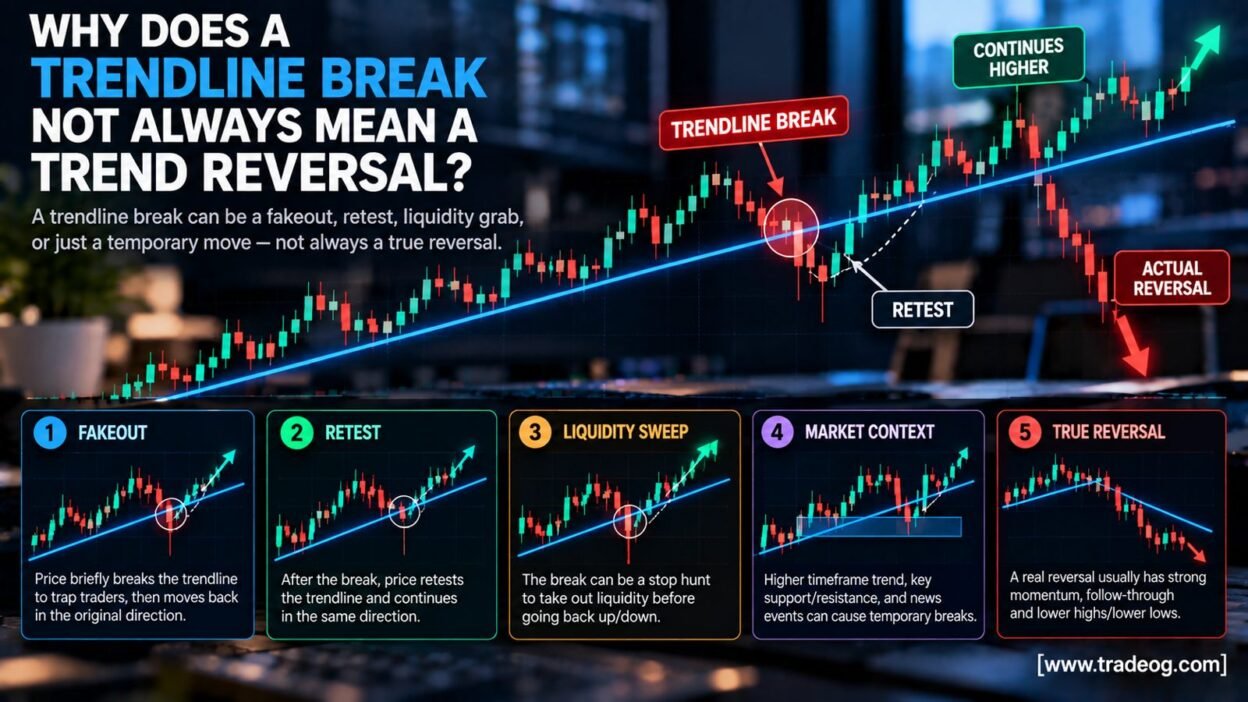
A trendline break is one of the most common signals traders use to identify a possible change in market direction. But a price move through a trendline does not automatically mean the trend has reversed.
Price can break a trendline because the market is slowing down, entering a range, making a temporary correction, reacting to news, or simply moving through a line that was drawn too aggressively. In other cases, the break can be the first stage of a genuine reversal.
The challenge is separating a meaningful structural change from a temporary break or fakeout.
What Is a Trendline Break?
An uptrend line is normally drawn by connecting meaningful swing lows. A downtrend line connects meaningful swing highs. The line gives traders a visual reference for the direction and pace of price movement.
A trendline break occurs when price moves through that projected line. However, because a trendline is a geometric reference rather than a fixed market price, crossing it only tells you that price is no longer respecting that particular line in exactly the same way.
It does not, by itself, prove that the entire trend has changed.
Why a Trendline Break Does Not Automatically Mean Reversal
There are several reasons a trendline can break while the broader trend remains intact.
- The trend may simply be losing momentum.
- Price may be entering a sideways range.
- The market may be shifting to a shallower trend angle.
- A temporary news move may push price through the line.
- The trendline may have been drawn from weak or subjective swing points.
- Price may sweep the line and quickly return.
- A stronger support or resistance zone may still control the market.
This is why the break should usually be treated as a warning of possible structural change, rather than a complete reversal signal.
A Trendline Shows Pace as Well as Direction
This is an important concept that is often overlooked.
Suppose EUR/USD is rising rapidly and an ascending trendline is drawn through several swing lows. If price later falls through that line, the market may simply be transitioning from a steep uptrend to a slower uptrend.
The original trendline has failed, but the broader bullish structure may still exist.
In other words, a trendline break can mean that the pace of the trend has changed without meaning that the direction has completely changed.
Trendline Break vs Trend Reversal
| Observation | What It May Mean |
|---|---|
| Price briefly crosses the line | Normal noise or temporary violation |
| Price closes beyond the line | Potential change in momentum |
| Price closes beyond and continues | Stronger evidence of structural change |
| Price retests the broken line and rejects | Supports the breakout thesis |
| Price reclaims the trendline quickly | Possible false break |
| Higher-timeframe structure also breaks | Stronger reversal evidence |
These are analytical observations, not guaranteed trading rules. Each strategy should define its own confirmation criteria and test them historically.
Wick Through the Trendline vs Candle Close
One of the simplest ways to avoid overreacting to trendline breaks is to distinguish between a wick and a sustained close.
Price can temporarily trade beyond a trendline and then close back on the original side. This shows that the market tested the area but does not establish that the break was accepted.
A candle that closes beyond the trendline provides more information, but even that is not guaranteed confirmation of a reversal.
The subsequent price action is often more useful than the first breach itself.
Why False Trendline Breaks Happen
A false break occurs when price crosses the trendline but then returns and resumes the previous structure.
This can happen because:
- selling or buying pressure was insufficient to sustain the move;
- price encountered a stronger nearby level;
- the market was temporarily illiquid;
- news caused a short-lived price shock;
- traders reacted to the same obvious technical level;
- the trendline was too steep or poorly constructed; or
- the market was already moving sideways.
A false break becomes easier to identify retrospectively, but traders should avoid assuming that every apparent break is a fakeout while the market is still developing.
Trendline Drawing Is Subjective
Two traders can look at the same chart and draw slightly different trendlines.
One trader may connect candle wicks, another may focus on candle bodies, and another may choose different swing points. Their trendlines can therefore break at different prices.
This subjectivity is one reason a trendline should not be treated like an exact support or resistance price.
The best practice is to define your drawing rules in advance and avoid repeatedly moving the line simply to make historical price action look cleaner.
Do Not Redraw the Trendline Just to Avoid a Break
A common mistake is to adjust a trendline every time price approaches or crosses it.
If a line needs to be repeatedly changed to keep the original trend intact, it may no longer be describing the market objectively.
Keep the original line for analysis, record what happened, and only draw a new trendline when a new set of meaningful swing points has developed.
Higher-Timeframe Structure Matters More
A trendline on a 15-minute chart can break while the daily trend remains completely intact.
For example, an intraday uptrend may break its 15-minute trendline and fall into a 1-hour support zone. If price holds that zone and begins forming higher lows again, the lower-timeframe break may have represented a correction rather than a complete reversal.
A practical hierarchy is:
- Weekly/Daily: major market structure.
- 4-hour/1-hour: intermediate trend and key zones.
- 15-minute: short-term structure.
- 5-minute and lower: entry refinement and short-term noise.
The exact timeframes depend on the trading strategy. The principle is to avoid interpreting a small timeframe in isolation.
What Happens After a Trendline Break?
There are several common outcomes.
1. Immediate continuation
Price breaks the trendline and continues strongly in the new direction.
2. Break and retest
Price breaks the trendline, returns to the area and then resumes the new direction.
3. False break
Price crosses the trendline but quickly returns to the original side.
4. Trend deceleration
The original trend continues but at a slower angle, making the original trendline obsolete.
5. Range formation
The trend ends temporarily and price begins moving sideways rather than immediately reversing.
Only one of these outcomes represents a clean directional reversal. The initial line break cannot tell you which one will occur with certainty.
Trendline Break and Retest
A retest can provide additional information after a break.
Imagine an ascending trendline breaks downward. Price then rallies back toward the broken line. If the area now acts as resistance and price starts falling again, the market has provided additional evidence that the previous bullish structure has weakened.
However, a retest is not mandatory. Sometimes price continues immediately without returning to the line.
Traders should therefore avoid treating a retest as a universal requirement.
Trendline Break vs Support Break
Trendlines and horizontal support levels are not the same.
A trendline is dynamic because its location changes with time. Horizontal support is generally a defined price zone based on previous market reactions.
Because of this, breaking a trendline can simply indicate that the slope or pace of a move has changed. A simultaneous break of a major horizontal support level can provide stronger evidence of a structural shift.
This connects directly with our guide on why a currency pair can break support and immediately reverse.
Liquidity Sweeps Around Trendlines
Obvious trendlines can attract attention from many traders. A temporary move through the line may trigger entries, stops or breakout orders before price returns.
Traders often call this a liquidity sweep or liquidity grab.
However, traders should be careful with the terminology. A reversal after a trendline break does not prove that a specific institution deliberately hunted retail stop losses. Price can reverse because of ordinary changes in liquidity, positioning and order flow.
The observable fact is the price behaviour; the exact underlying motive may not be knowable from a chart alone.
How News Can Create a Trendline Fakeout
Major economic releases can cause rapid price movement. A currency pair may briefly break a trendline immediately after a release and then reverse as the market fully interprets the information.
Central-bank decisions, inflation data, employment reports and unexpected policy comments can all change market expectations quickly.
During these periods, a trendline break should be interpreted alongside the event risk rather than treated as an isolated technical signal.
Why Trendline Breaks Can Be More Frequent During High Volatility
When price ranges become larger, candles can cross diagonal trendlines more frequently. A line that worked reasonably well during a calm trend may suddenly be crossed repeatedly when volatility expands.
This does not necessarily mean the trend has reversed every time. It may simply mean that the trendline has become less useful for describing the current market conditions.
For high-volatility conditions, traders should pay more attention to completed candle structure, nearby horizontal levels and higher-timeframe context.
How to Confirm a Genuine Trend Reversal
There is no universal confirmation formula, but a stronger reversal thesis can involve several pieces of evidence appearing together.
- A decisive break of the trendline.
- A meaningful close beyond the line.
- Failure to reclaim the previous trend structure.
- A break of an important swing high or swing low.
- Agreement with higher-timeframe structure.
- A successful retest or clear continuation.
- Enough room before the next major support or resistance zone.
The more independent evidence that agrees, the stronger the case becomes. It still does not create certainty.
Market Structure Is More Important Than the Line
Consider an uptrend making higher highs and higher lows.
The trendline breaks, but the most recent higher low remains intact. Price then forms another higher low and moves higher.
The trendline failed, but the market structure did not.
Now consider the opposite scenario. Price breaks the trendline, breaks the most recent higher low, fails to reclaim it and begins producing lower highs and lower lows.
That is a much stronger indication that the market structure itself has changed.
This is why traders should treat the trendline as one piece of information rather than the entire definition of the trend.
Example: EUR/USD Trendline Break That Is Not a Reversal
Suppose EUR/USD is in an established uptrend. The pair has formed several higher lows, and an ascending trendline connects those lows.
Price later falls below the line during a normal pullback. However, the pair remains above a major 4-hour support zone. It then stabilises and forms a new higher low before moving upward.
The original trendline has been broken, but the broader bullish structure remains intact.
In this situation, calling the first trendline break a complete reversal would have been premature.
Example: EUR/USD Trendline Break That Develops Into a Reversal
Now imagine the same pair breaks its ascending trendline and then also breaks a major swing low.
Price attempts to recover but cannot reclaim the broken structure. A lower high forms, followed by another lower low.
At that point, the evidence of a genuine bearish structural change is considerably stronger than it was at the first trendline break.
The difference is follow-through and structure, not simply the first candle crossing the line.
How Indian Traders Can Use Trendline Breaks More Carefully
Indian traders often use trendlines on EUR/USD, GBP/USD, USD/JPY, XAU/USD and other actively traded markets.
For short-term trading, it can be tempting to react immediately when a trendline breaks. But the lower the timeframe, the more frequently normal price noise can produce apparent breaks.
A practical approach is to:
- Mark the higher-timeframe trend first.
- Draw the trendline using consistent swing rules.
- Identify nearby horizontal support and resistance.
- Check the economic calendar before major sessions.
- Wait for the type of confirmation required by the strategy.
- Define invalidation before entering.
- Calculate position size based on acceptable risk.
Common Mistakes Traders Make With Trendline Breaks
Entering on the first tick
A tiny breach can reverse before the candle closes.
Ignoring candle closes
Intrabar movement can be very different from where the candle ultimately closes.
Ignoring horizontal levels
A trendline break directly into strong support may have limited bearish follow-through.
Using too many trendlines
A chart covered with diagonal lines can create conflicting signals and encourage hindsight analysis.
Constantly redrawing lines
Moving a line whenever price challenges it can turn analysis into curve fitting.
Assuming every break is a liquidity hunt
A reversal does not prove that a particular participant deliberately triggered stops.
Risking too much because the setup looks obvious
Even apparently clean technical setups can fail. Risk should be defined before the trade.
Trendline Breaks and Risk Management
A trendline break is an analytical event, not a reason to increase leverage.
Before entering a trade, determine:
- where the setup becomes invalid;
- how much capital can be risked;
- where the next major support or resistance is located;
- whether the spread and execution conditions are normal; and
- whether the potential reward justifies the risk.
In leveraged forex trading, a fast reversal after a false breakout can produce losses quickly. A technical signal should therefore always be combined with appropriate risk controls.
Trendline Break Checklist
- Did price actually close beyond the trendline?
- Was the break significant relative to recent volatility?
- Is there strong horizontal support or resistance nearby?
- What does the higher timeframe show?
- Did market structure also change?
- Did price reclaim the trendline?
- Was there a retest?
- Is major economic news affecting the move?
- Are spreads and liquidity normal?
- Does the setup meet the strategy’s predefined rules?
Final Takeaway
A trendline break does not automatically mean a trend reversal because a trendline only describes one aspect of market structure: the path or pace of price movement.
Price can break the line and continue trending at a slower angle, enter a range, create a false breakout, react temporarily to news or eventually develop into a genuine reversal.
The most useful confirmation usually comes from what happens after the break. Candle closes, follow-through, retests, horizontal levels and higher-timeframe market structure can provide much more information than the first cross of the line.
For traders, the key lesson is simple: do not trade the line in isolation; trade the market structure around it.
Frequently Asked Questions
Does a trendline break mean the trend has reversed?
No. It means price has moved through the projected trendline. The broader trend may continue, slow down, enter a range or genuinely reverse.
Should I wait for a candle close after a trendline break?
Many traders use candle closes to reduce the impact of intrabar noise, but the correct confirmation rule depends on the strategy. A close alone still does not guarantee a reversal.
What is a false trendline breakout?
It is a move through a trendline that fails to sustain itself, followed by a return to the previous side of the line or continuation of the original structure.
Is a trendline break more important on a higher timeframe?
Generally, higher-timeframe structure tends to carry more context than a very short-term trendline. However, the importance depends on the market and trading strategy.
Can a trendline break be a continuation signal?
Yes. A steep trend can break its original trendline and continue in the same direction at a slower pace. The break can therefore indicate deceleration rather than reversal.
What confirms a genuine trend reversal?
There is no universal confirmation. Traders may look for a trendline break combined with a meaningful swing-structure break, failed retest, continued movement in the new direction and higher-timeframe agreement.
Disclaimer
TradeOG Disclaimer: This article is provided for educational and informational purposes only. It is not investment advice, financial advice, trading advice, or a recommendation to buy, sell or hold any currency pair, CFD, derivative or other financial instrument.
Forex and leveraged trading involve substantial risk of loss. Trendlines, price action, support and resistance, market structure, liquidity concepts and other technical-analysis tools cannot predict future price movements with certainty. Any examples involving EUR/USD, XAU/USD, hypothetical entries, trendline breaks, retests or market scenarios are illustrative only and are not trade recommendations or guarantees of future results.
Market conditions can change rapidly because of economic releases, central-bank decisions, geopolitical events, liquidity conditions, spreads, volatility, positioning and execution factors. Historical price behaviour does not guarantee future results. Different brokers and data providers may also display slightly different prices, highs, lows or chart structures.
Readers should independently verify information, understand the risks of leverage and consider their own financial circumstances, experience, risk tolerance and applicable laws and regulations before making any trading decision. TradeOG does not guarantee the accuracy, completeness or future relevance of the information presented and is not responsible for losses arising from reliance on this content.
If you require personalised financial guidance, consult a qualified and appropriately authorised financial professional.