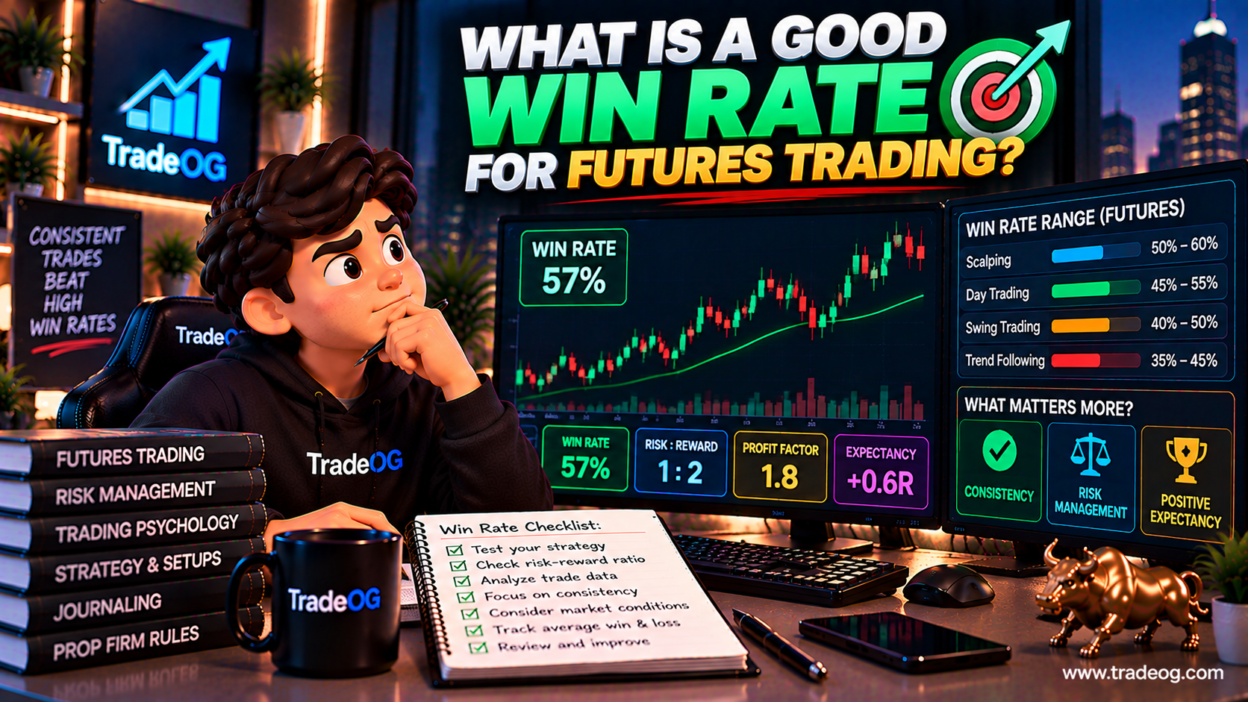
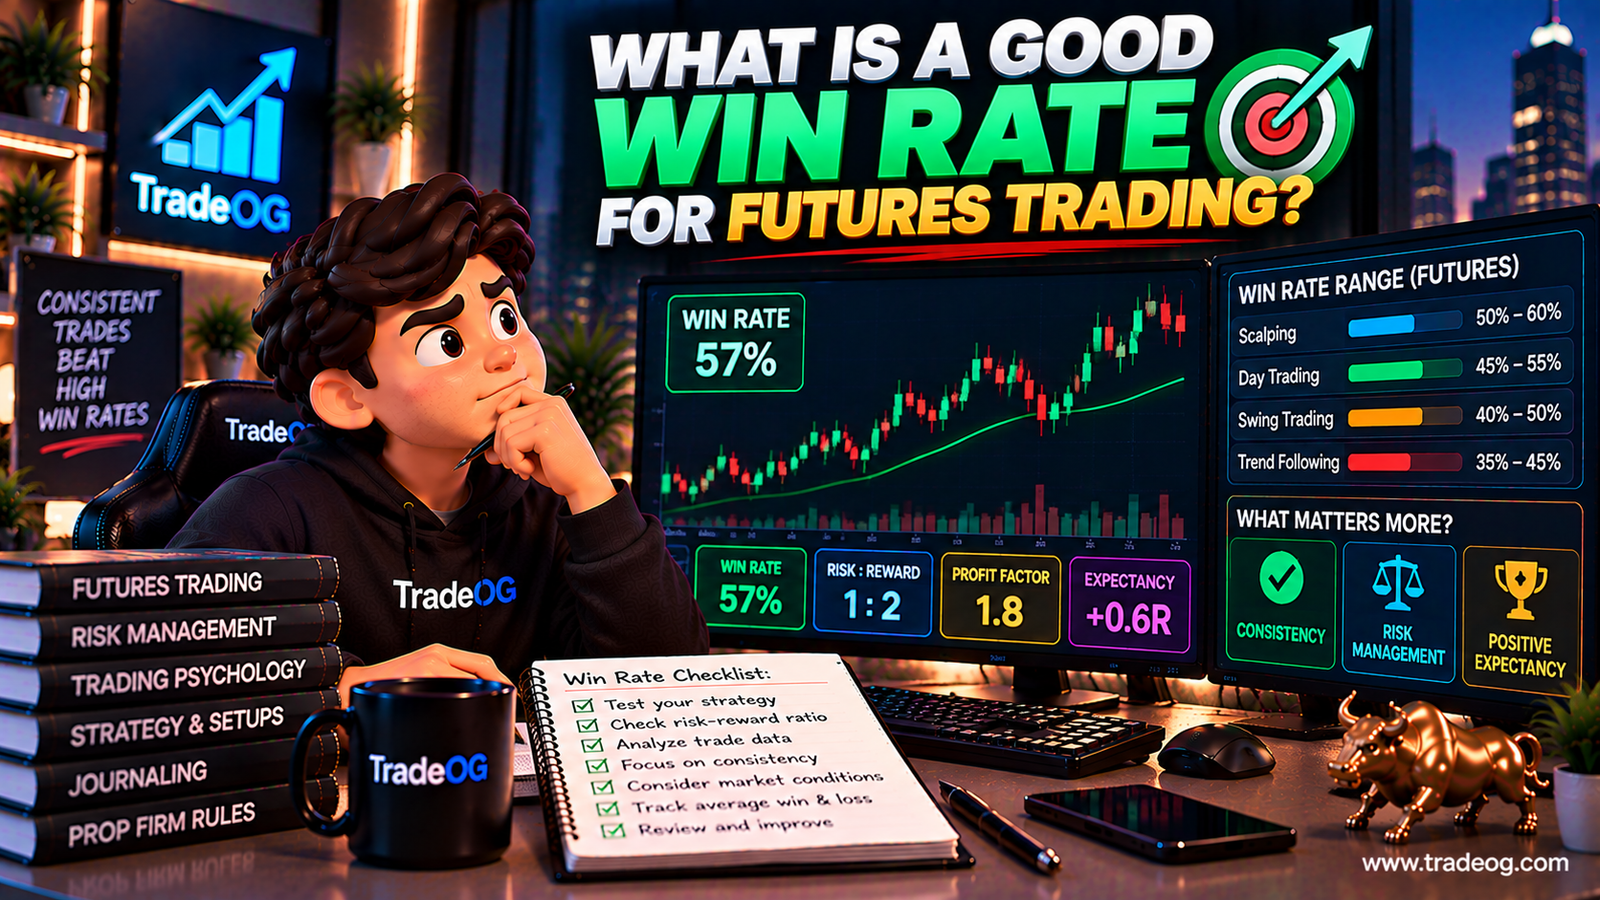
What is a good win rate for futures trading? It is one of the first questions traders ask when evaluating a strategy, building a trading journal or preparing for a prop firm challenge.
A strategy that wins 70% of its trades may look impressive. A strategy that wins only 40% may look weak at first glance. But the win rate alone cannot tell you whether either strategy is profitable.
That is because trading performance depends on the relationship between win rate, average win, average loss, trading costs, position sizing, drawdown and execution quality.
A futures strategy can potentially be profitable with a win rate below 50% if its average winning trade is sufficiently larger than its average losing trade. Conversely, a strategy can have a high win rate and still lose money if occasional losses are much larger than the typical winners.
This distinction is particularly important for prop traders because a strategy must be evaluated not only by its theoretical profitability but also by whether its drawdown profile, losing streaks and risk model fit the account rules.
What Is Win Rate in Futures Trading?
Win rate, also called the winning percentage, measures the proportion of closed trades that produced a positive result.
The basic formula is:
Win Rate = Winning Trades ÷ Total Trades × 100
For example, suppose a futures trader takes 100 completed trades:
- 55 trades are profitable;
- 45 trades are losing trades.
The win rate is:
55 ÷ 100 × 100 = 55%
That tells you how frequently the strategy won, but it does not tell you how much money the strategy made.
So What Is a “Good” Win Rate?
There is no single win-rate percentage that should be called good for every futures strategy.
A useful way to think about it is:
A good win rate is one that works with the strategy’s average win, average loss, costs and risk model to produce acceptable expectancy and drawdown characteristics.
A 40% win rate can be mathematically viable under one risk-to-reward structure, while a 70% win rate can be unattractive under another.
Therefore, avoid judging a futures strategy by win rate alone.
Why 50% Win Rate Is Not the Break-Even Point
Many new traders assume that winning half of their trades means they are breaking even.
That is only true under a simplified situation where average winning trades and average losing trades are equal and trading costs are ignored.
Suppose:
- win rate = 50%;
- average win = $100;
- average loss = $100.
With 100 trades:
50 × $100 − 50 × $100 = $0
Before commissions, exchange fees, spread and slippage, the result is approximately break-even.
But change the average win to $150 while keeping the average loss at $100:
50 × $150 − 50 × $100 = $2,500
Now the same 50% win rate produces a positive gross result.
This is why win rate must be interpreted together with average win and average loss.
The Break-Even Win Rate Formula
Ignoring trading costs for a moment, the approximate break-even win rate can be calculated as:
Break-Even Win Rate = Average Loss ÷ (Average Win + Average Loss)
Suppose your average winning trade is $200 and your average losing trade is $100.
Then:
$100 ÷ ($200 + $100) = 33.33%
So, under this simplified model, the strategy needs to win more than roughly 33.3% of trades to have positive gross expectancy.
Once commissions, fees and slippage are included, the practical break-even point changes.
Win Rate and Risk-to-Reward Ratio
Risk-to-reward is one of the biggest reasons two traders can have completely different required win rates.
| Average Win | Average Loss | Approx. Break-Even Win Rate* |
|---|---|---|
| $100 | $100 | 50% |
| $150 | $100 | 40% |
| $200 | $100 | 33.3% |
| $300 | $100 | 25% |
| $400 | $100 | 20% |
*Simplified mathematical examples before costs, slippage and other execution effects.
A higher average reward relative to average loss can reduce the win rate needed for positive expectancy, but that does not mean traders should simply increase profit targets. The relationship must be supported by the strategy’s actual market behaviour.
Example: Two Futures Strategies With Very Different Win Rates
Consider two hypothetical strategies.
Strategy A
- Win rate: 65%
- Average win: $80
- Average loss: $150
Its expectancy per trade is:
(0.65 × $80) − (0.35 × $150) = $52 − $52.50 = -$0.50
Despite a 65% win rate, the simplified gross expectancy is slightly negative.
Strategy B
- Win rate: 45%
- Average win: $200
- Average loss: $100
Its expectancy is:
(0.45 × $200) − (0.55 × $100) = $90 − $55 = $35
Strategy B has a lower win rate but higher positive expectancy under this simplified example.
This is why the question “What is a good win rate?” is incomplete without asking about the distribution of wins and losses.
What Win Rate Is Common for Futures Traders?
There is no reliable universal win-rate range that applies to all futures traders.
Different strategies have different statistical profiles.
For example:
- mean-reversion systems may produce frequent smaller winners and occasional larger losses;
- trend-following systems may accept many losing trades while waiting for larger moves;
- breakout strategies can experience clusters of failed breakouts;
- scalping strategies may depend heavily on execution costs and small price movements;
- discretionary traders may have very different results across market regimes.
Therefore, a win rate should be compared with the historical distribution of the same strategy, market, timeframe and execution model, not with a generic number from another trader.
Why a 70% Win Rate Can Be Dangerous to Interpret
A high win rate can create false confidence.
Suppose a strategy wins 70 out of 100 trades but loses $300 on each losing trade while making only $100 on each winning trade.
The simplified result is:
70 × $100 − 30 × $300 = $7,000 − $9,000 = -$2,000
The trader won seven out of every ten trades and still lost money.
This is a classic example of why win rate is not the same thing as profitability.
Why a 40% Win Rate Can Be Profitable
Now consider:
- 40 winning trades;
- 60 losing trades;
- average win = $250;
- average loss = $100.
The simplified result is:
40 × $250 − 60 × $100 = $10,000 − $6,000 = $4,000
The win rate is only 40%, but the average winner is much larger than the average loser.
That is why trend-following and breakout systems can sometimes operate with relatively modest win rates while still producing positive expectancy.
Win Rate vs Expectancy
Win rate tells you how often you win.
Expectancy estimates how much you expect to gain or lose per trade based on the strategy’s historical assumptions.
A simplified expectancy formula is:
Expectancy = (Win Rate × Average Win) − (Loss Rate × Average Loss)
This metric is usually much more informative than win rate alone when comparing trading systems.
CME Group’s educational material on the mathematics of trading success also emphasizes that trading performance should be evaluated mathematically rather than by focusing on one statistic in isolation. CME Group — The Mathematics of Trading Success.
Win Rate and Profit Factor
Another useful metric is profit factor.
Profit Factor = Gross Profit ÷ Gross Loss
For example, if a strategy generates $12,000 in gross winning trades and $8,000 in gross losing trades:
$12,000 ÷ $8,000 = 1.50
A profit factor above 1 means gross profits exceed gross losses in the measured sample, although it does not guarantee future profitability.
Profit factor can provide useful context alongside win rate.
Win Rate and Maximum Consecutive Losses
A strategy can have a high win rate and still experience losing streaks.
For example, a 60% win-rate strategy does not mean the trader will alternate between wins and losses.
Real trade sequences can look like:
W W L W L L W W W L L L W…
A cluster of losses can occur even when the long-run win rate is positive.
This matters for futures traders because losing streaks affect:
- drawdown;
- position sizing;
- psychology;
- prop-firm account survival;
- ability to continue executing the strategy.
Win Rate and Prop Firm Challenges
Prop firm traders often make the mistake of asking:
“What win rate do I need to pass?”
There is no universal answer.
A challenge account may have a profit target, maximum loss, daily loss mechanism, consistency requirement or position-size limit. The interaction between these rules and your strategy’s expectancy matters more than a standalone win-rate percentage.
For example, a trader with a 45% win rate and a strong average win/loss relationship could potentially have a different drawdown profile from a trader with a 70% win rate and much larger occasional losses.
Current prop-firm rules also vary. Topstep’s current Trading Combine parameters include a Profit Target, Maximum Loss Limit, Consistency Target and maximum position size. Topstep — Trading Combine Parameters.
What Matters More Than Win Rate in a Prop Challenge?
When evaluating a strategy for a prop account, consider at least:
- expectancy;
- average R-multiple;
- average win;
- average loss;
- maximum drawdown;
- maximum consecutive losses;
- daily loss clusters;
- position-size consistency;
- trading costs;
- slippage;
- rule violations.
A strategy should fit the account’s risk constraints, not simply produce an attractive win-rate statistic.
What Is a Good Win Rate for Scalping Futures?
There is no universal good win rate for scalping.
Scalping often involves smaller price targets, which means execution costs can represent a larger proportion of each trade’s expected profit.
A scalper should therefore track:
- gross win rate;
- net win rate after costs;
- average winner;
- average loser;
- average holding time;
- commission and exchange costs;
- slippage;
- profit factor;
- expectancy.
A strategy that looks profitable before costs may behave very differently after realistic execution costs.
What Is a Good Win Rate for Day Trading Futures?
Day trading strategies can have many different statistical profiles.
A breakout trader might accept a lower win rate because successful breakouts can generate larger winners.
A mean-reversion trader might target smaller moves and therefore require a different win/loss relationship.
The correct benchmark is your strategy’s tested distribution rather than a generic day-trading percentage.
What Is a Good Win Rate for NQ and MNQ?
NQ and MNQ are different contract sizes, but changing the contract does not automatically create a different required win rate.
If the entry and exit methodology are identical, the percentage of winning trades can theoretically be similar.
What changes is the dollar exposure because contract specifications differ.
That means a trader should distinguish between:
- probability: how often the setup wins;
- exposure: how much money is gained or lost when it wins or loses.
Position size should therefore be calculated from the risk model rather than selected because a particular contract “feels” more affordable.
What Is a Good Win Rate for ES and MES?
The same principle applies to ES and MES.
Changing from a Mini to a Micro contract changes dollar exposure and position-size granularity, but it does not automatically improve the underlying strategy’s probability of winning.
CME’s Micro E-mini equity-index contracts are designed at one-tenth the size of their corresponding E-mini contracts, which can provide finer position sizing. CME Group — S&P 500 and Nasdaq-100 Futures.
Win Rate and Risk Per Trade
Win rate becomes more useful when combined with fixed risk.
Suppose two traders both have a 55% win rate.
| Trader | Win Rate | Average Win | Average Loss |
|---|---|---|---|
| A | 55% | $100 | $100 |
| B | 55% | $200 | $100 |
Trader A has approximately zero gross expectancy before costs.
Trader B has positive gross expectancy:
(0.55 × $200) − (0.45 × $100) = $65 per trade
The win rate is identical. The expectancy is not.
Win Rate and R-Multiple
R-multiple expresses a trade’s outcome relative to its initial risk.
If the initial risk is $100:
- +$100 = +1R;
- +$200 = +2R;
- -$100 = -1R.
A strategy can therefore be analyzed without relying entirely on account currency.
For example, suppose 100 trades produce:
- 50 winners averaging +1.5R;
- 50 losers averaging -1R.
The average expectancy is:
(0.50 × 1.5R) − (0.50 × 1R) = +0.25R
This makes it easier to compare performance across different account sizes.
Why Net Win Rate Matters
Gross trading results are not always the same as net results.
Futures traders may incur:
- commissions;
- exchange fees;
- market-data costs;
- platform costs;
- slippage.
If a strategy takes very small profits, these costs can materially change its expectancy.
Therefore, your journal should ideally calculate both gross and net performance.
How Many Trades Do You Need to Judge Win Rate?
A very small sample can be misleading.
Suppose a new strategy takes ten trades and wins eight.
The measured win rate is 80%.
That does not establish that the strategy’s long-run win rate is 80%.
The same problem occurs when a strategy loses eight of its first ten trades.
Short samples can contain substantial randomness.
For serious evaluation, collect a sufficiently large and representative sample across the market conditions in which you intend to trade.
Win Rate Stability Matters
Do not only calculate one overall win rate.
Break the data down by:
- month;
- market regime;
- instrument;
- session;
- setup;
- long vs short;
- day of week;
- volatility environment.
You may discover that a strategy’s overall 55% win rate is actually:
- 65% during one market condition;
- 48% during another;
- 35% during a third.
This is more useful than assuming the strategy will always produce 55%.
Win Rate and Market Regimes
Markets change.
A trend-following strategy can perform differently during:
- strong directional markets;
- range-bound markets;
- high-volatility sessions;
- low-volatility sessions;
- news-driven markets.
That means a historical win rate is a measurement of a particular sample, not a permanent property of the strategy.
Win Rate and Overfitting
Be careful when optimizing a strategy until the backtest produces an extremely attractive win rate.
Adding enough filters can make historical results look excellent while reducing robustness in live markets.
For example, a trader could keep adding:
- time filters;
- indicator conditions;
- volatility filters;
- news exclusions;
- specific candle patterns;
- session restrictions.
Eventually the historical sample may contain only a small number of unusually favourable trades.
A high backtested win rate is not automatically evidence of a robust strategy.
Win Rate vs Maximum Drawdown
Two strategies can have the same win rate but very different drawdowns.
Consider:
| Metric | Strategy A | Strategy B |
|---|---|---|
| Win rate | 55% | 55% |
| Average win | +1R | +2R |
| Average loss | -1R | -1R |
| Typical losing streak | 3 | 5 |
| Maximum drawdown | Different | Different |
The win rate alone cannot explain the difference.
For prop traders, drawdown behaviour can be just as important as the average result.
Win Rate and Consecutive Losses
A 55% win rate means a 45% historical loss rate in the measured sample.
It does not mean every second trade will lose.
Losing trades can cluster.
This is why traders should calculate:
- maximum historical consecutive losses;
- average losing streak;
- same-day losing clusters;
- drawdown during losing streaks.
Then test whether the position size remains appropriate during those sequences.
What Win Rate Should You Aim For?
Instead of choosing a target win rate first, start with the strategy.
Ask:
- What is the strategy’s historical win rate?
- What is the average win?
- What is the average loss?
- What is expectancy?
- What is the maximum drawdown?
- What is the maximum consecutive-loss streak?
- What happens after realistic costs?
- How stable are the results across market conditions?
Then decide whether the complete distribution fits your trading plan.
How to Improve Win Rate Without Ruining Expectancy
Increasing win rate is not automatically beneficial.
For example, a trader may increase win rate by taking profits earlier.
That can reduce average win size.
Another trader may increase win rate by widening stops.
That can increase average loss.
A third trader may remove every trade that lost during backtesting.
That creates selection bias.
The objective should not be:
“Make the win rate as high as possible.”
The objective should be:
“Improve the complete risk-adjusted performance profile without destroying the strategy’s robustness.”
How to Track Win Rate in a Trading Journal
At minimum, record:
| Field | Example |
|---|---|
| Total trades | 100 |
| Winning trades | 55 |
| Losing trades | 45 |
| Win rate | 55% |
| Average win | +1.4R |
| Average loss | -1R |
| Expectancy | Calculated from sample |
| Profit factor | Calculated from sample |
| Maximum drawdown | Calculated from sample |
| Maximum consecutive losses | Calculated from sample |
This gives you a much clearer picture than win rate alone.
A Practical Futures Win-Rate Evaluation Framework
Step 1: Calculate win rate
Count winning trades and divide by total completed trades.
Step 2: Calculate average win and average loss
Do not use only the biggest winners and losers.
Step 3: Calculate expectancy
Use the actual historical distribution.
Step 4: Include costs
Use realistic commissions, fees and slippage.
Step 5: Measure drawdown
Look at the complete equity curve, not just total profit.
Step 6: Measure losing streaks
Determine whether the account can tolerate normal losing sequences.
Step 7: Segment the results
Review the strategy by setup, market, session and regime.
Step 8: Forward-test
Check whether live execution resembles the historical model.
What a Strong Trading Report Looks Like
Instead of reporting:
“My strategy has a 62% win rate.”
report something closer to:
- 62% historical win rate;
- 1.3R average winner;
- 1R average loser;
- +0.43R expectancy before costs;
- 1.6 profit factor;
- maximum 6 consecutive losses;
- maximum drawdown of 7.2R;
- results tested across multiple market conditions;
- net results after realistic costs.
Those numbers describe the strategy far better than win rate alone.
Win Rate and Trading Psychology
Win rate also affects psychology.
A trader who expects an 80% win rate may panic when three trades lose in a row.
A trader whose strategy historically wins 45% of the time may be more prepared for losing sequences.
Knowing the expected distribution can make it easier to follow the plan without changing rules after a normal losing streak.
Why Traders Obsess Over Win Rate
Win rate is easy to understand.
It is a single percentage.
It also feels emotionally rewarding to say:
“I win 70% of my trades.”
But trading is not a contest to maximize the percentage of green trades.
The objective is to develop a repeatable process with positive expectancy and controlled risk.
Can a 30% Win Rate Be Good?
Mathematically, yes, depending on the average win-to-loss relationship.
Suppose:
- win rate = 30%;
- average win = $400;
- average loss = $100.
Expectancy:
(0.30 × $400) − (0.70 × $100) = $120 − $70 = $50
The simplified expectancy is positive before costs.
However, a 30% win rate also means losing trades are common, so the trader must be psychologically and financially prepared for losing streaks.
Can a 90% Win Rate Be Bad?
Yes.
If the average winning trade is tiny and the occasional loss is extremely large, a 90% win rate can still produce negative expectancy.
This pattern can occur in systems that repeatedly collect small profits while occasionally taking a large loss.
The statistic looks impressive while the underlying payoff distribution is poor.
What Win Rate Is Good for a Prop Firm Challenge?
There is no universal prop-firm win-rate requirement.
The relevant question is whether your complete strategy profile can operate within the account’s constraints.
For example, a lower-win-rate strategy may need enough drawdown capacity to survive its normal losing streak. A higher-win-rate strategy may still be unsuitable if its occasional losses are too large.
Current challenge rules differ by provider and program. Always evaluate the exact account parameters before deciding whether a strategy is appropriate.
Final Takeaway
There is no single “good” win rate for futures trading.
A useful win rate is one that works with the strategy’s average win, average loss, costs, drawdown and execution characteristics to produce a robust trading process.
Instead of asking only:
“What percentage of my trades should win?”
ask:
- How much do I make when I win?
- How much do I lose when I lose?
- What is my expectancy?
- How large can my losing streak become?
- What is my maximum drawdown?
- What happens after commissions and slippage?
- Does the strategy remain consistent across market conditions?
- Can my prop-firm account tolerate the strategy’s normal losing sequence?
A 40% win rate with strong positive expectancy can be more useful than a 70% win rate with poor payoff asymmetry. Conversely, a high win rate combined with favourable average wins, controlled losses and manageable drawdown can also be a strong statistical profile.
The important point is that win rate is a component of a trading system, not the definition of a good trading system.
For futures traders, the better evaluation is a complete scorecard covering win rate, average R, expectancy, profit factor, drawdown, consecutive losses and net performance after costs.
FAQs
What is a good win rate for futures trading?
There is no universal percentage. A good win rate depends on average win, average loss, costs, expectancy and drawdown. A strategy can potentially be profitable below 50% if its average winners are sufficiently larger than its average losers.
Is a 50% win rate good?
It can be. If average wins are larger than average losses, a 50% win rate can produce positive expectancy before costs. If wins and losses are equal, it is approximately break-even before costs.
Is a 60% win rate good for futures?
A 60% win rate can be useful, but it does not establish profitability by itself. Check average win, average loss, expectancy, drawdown and trading costs.
Can a futures strategy make money with a 40% win rate?
Yes, mathematically. If the average winning trade is sufficiently larger than the average losing trade, the strategy can have positive expectancy despite winning fewer than half of its trades.
Can a 70% win rate still lose money?
Yes. If losing trades are much larger than winning trades, the strategy can have negative expectancy despite a high win rate.
How many trades are needed to evaluate win rate?
There is no single magic sample size. A meaningful evaluation should use enough trades to reduce the influence of short-term randomness and should represent the market conditions in which the strategy will actually be traded.
Should prop traders target a specific win rate?
Rather than targeting a standalone win-rate percentage, prop traders should evaluate whether the complete strategy profile fits the account’s drawdown, loss, position-size and other rules.
What is more important than win rate?
Expectancy, average win, average loss, drawdown, losing streaks, profit factor, execution costs and consistency across market conditions are all important complementary metrics.
Does a higher win rate mean lower risk?
No. Risk depends on position size, stop distance, loss size, drawdown structure, leverage and other factors. A high win rate does not prevent a large losing trade.
Should I change my strategy to increase win rate?
Not automatically. Increasing win rate by taking smaller profits, widening stops or filtering too aggressively can reduce overall expectancy or robustness. Evaluate the complete statistical profile instead.
TradeOG risk note: This article is educational and uses simplified mathematical examples. Futures trading involves substantial risk, and historical win rates do not guarantee future results. Contract specifications, commissions, platform rules and prop-firm account conditions vary and can change; verify current official rules and specifications for your specific account before trading.