Forex traders often think of a candlestick as a simple four-number object: open, high, low and close. But those four values are the result of a much more detailed stream of price updates. When the underlying tick data changes, the shape of the candle can change too — including its body, upper wick, lower wick and even whether a candle appears bullish, bearish or almost like a doji.
This matters most on short timeframes. A one-minute or five-minute candle compresses many individual price changes into one visual object. If two platforms receive different tick streams, use different quote conventions, or build charts from different broker feeds, the resulting candle can look different even when both platforms are showing the same currency pair.
MetaTrader 5 explains that one-minute bars are formed from symbol quotes or ticks and contain the Open, High, Low and Close for that minute. For OTC instruments, its documentation notes that charts are based on Bid prices, while trading itself occurs using Bid and Ask prices. MetaTrader 5 Price Data documentation and Market Watch documentation.
What Is Tick Data in Forex?
A tick is an individual price update received by a trading platform. Depending on the instrument and data feed, a tick can contain Bid, Ask, Last, volume and flags describing which values changed.
That is very different from a one-minute candle. A candle is a summary. Tick data is the underlying sequence from which that summary can be constructed.
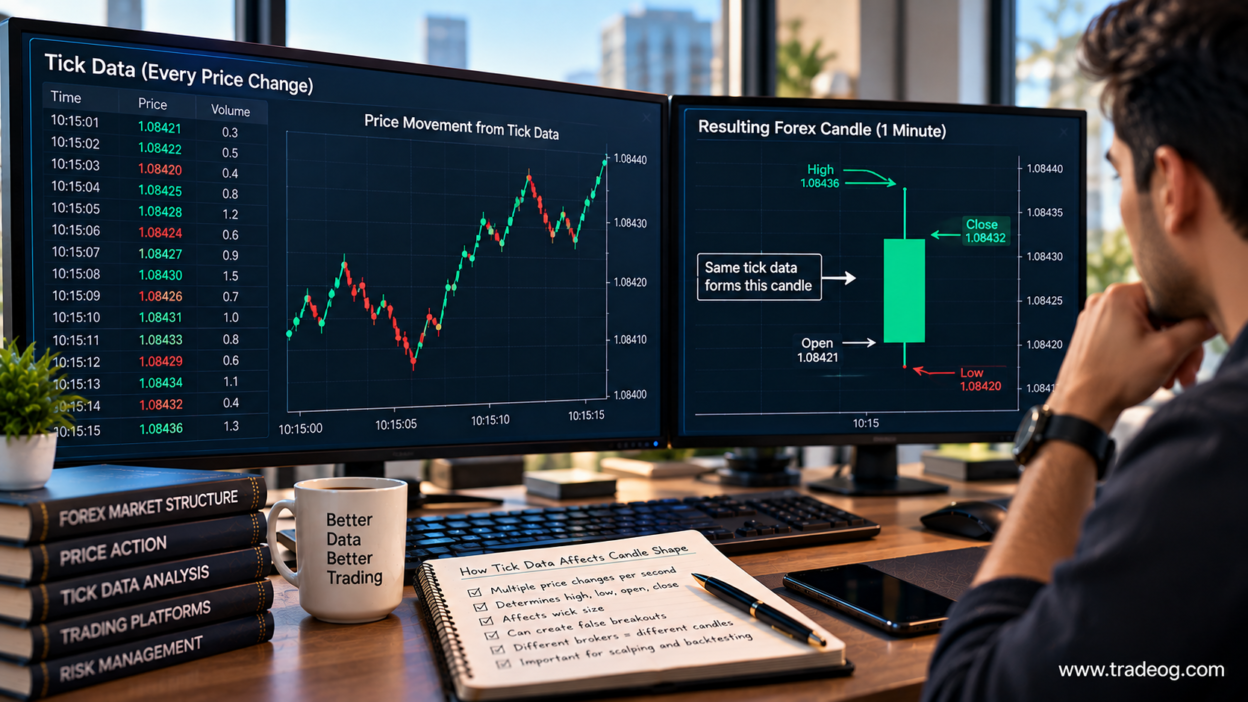
For example, imagine EUR/USD produces these simplified Bid updates during one minute:
| Time | Bid |
|---|---|
| 10:15:01 | 1.08421 |
| 10:15:04 | 1.08428 |
| 10:15:07 | 1.08420 |
| 10:15:11 | 1.08434 |
| 10:15:15 | 1.08432 |
The candle does not display all five movements. Instead, it summarizes the minute as:
- Open: 1.08421
- High: 1.08434
- Low: 1.08420
- Close: 1.08432
The wick and body therefore depend on the actual sequence of prices received during that minute.
How Tick Data Creates a Forex Candle
The easiest way to understand the relationship is to think of a candle as a compression algorithm.
Hundreds or thousands of price updates can arrive during an active minute. The chart compresses that information into four primary prices. The first relevant price becomes the Open, the highest becomes the High, the lowest becomes the Low, and the final relevant price becomes the Close.
MetaTrader 5 states that one-minute bars contain Open, High, Low and Close, along with spread, tick volume and time. It also stores quote history as minute bars, with higher timeframes calculated from that underlying data. MetaTrader 5 Price Data documentation and Market Watch documentation.
This is why a trader should not think of the candle as the market itself. The candle is a visual representation of a stream of market data.
Why One Extra Tick Can Change the Candle Shape
Consider a one-minute bullish candle that opens at 1.08420 and closes at 1.08435. Suppose the highest price recorded is 1.08438. The candle has a small upper wick.
Now imagine another data feed records one additional price update at 1.08444 before the market returns to 1.08435.
The Open and Close may remain identical, but the High has changed. The upper wick is now longer.
The difference may be only a few fractional points, yet visually the candle has changed. On a very short timeframe, that difference can affect how traders interpret rejection, breakout strength, liquidity sweeps or a possible reversal.
Tick Data Determines the High and Low
The High and Low are especially sensitive to the underlying tick stream because a single extreme quote can become the candle’s maximum or minimum.
Suppose two brokers receive slightly different quote sequences:
| Data feed | High | Low |
|---|---|---|
| Feed A | 1.08442 | 1.08419 |
| Feed B | 1.08445 | 1.08421 |
The bodies might look almost identical, but the wicks will not. If a trader places a horizontal level at 1.08443, Feed B may show a break while Feed A does not.
This is one reason traders sometimes see a candle apparently touch or break a level on one broker but not another. The issue is not necessarily that one platform is wrong. The feeds may simply contain different quote histories.
TradeOG has previously covered related broker-feed differences in Why Two Brokers Can Show Different Forex Highs and Lows and Why Your MT5 Chart Price Can Differ From Another Broker.
Why the Wick Can Change Without a Big Change in the Candle Body
A common misunderstanding is that a different wick must mean a completely different market move. Not necessarily.
Imagine price spends most of the minute between 1.08425 and 1.08435. For a fraction of a second, one quote reaches 1.08445 and then returns to 1.08430.
That brief excursion can create a long upper wick even though most of the minute was spent much lower.
Another feed that does not record that exact quote may show a much shorter wick. The two candles can therefore communicate slightly different visual stories about the same short period.
Bid, Ask and Last Can Make the Difference Confusing
Forex is not a single-price market in the same way many beginners imagine. There is a Bid price and an Ask price. MetaTrader 5 defines Bid as the best price at which the instrument can be sold and Ask as the best price at which it can be bought. Its OTC documentation says charts are based on Bid prices, while actual trading takes place using Bid and Ask prices. MetaTrader 5 Price Data documentation.
That distinction matters when comparing what appears on a chart with what happened to a trade.
A trader might see the Bid chart touch a level while a Buy order is executed at the Ask. Conversely, a Sell position is affected by the Bid when it is closed.
During periods of changing spreads, the difference between chart price and executable price can become more noticeable.
For a deeper explanation of quote timing, see Why Forex Quotes Can Change Before Your Trading Platform Refreshes.
Tick Volume Is Not the Same as Real Trading Volume
Another source of confusion is tick volume.
Tick volume generally measures the number of price updates received during a period. It does not automatically mean that the same number of lots or contracts changed hands.
MetaTrader 5 distinguishes tick volume from real deal volume and notes that real volume may not be available for OTC markets. MetaTrader 5 Price Data documentation.
Therefore, a one-minute candle with 800 ticks does not necessarily mean 800 trades occurred. It means the platform received a large number of relevant updates according to its data source.
Why Different Brokers Can Produce Different Candles
Spot forex is an OTC market, and retail brokers can receive prices through different liquidity arrangements and pricing systems. A broker may aggregate quotes from liquidity providers, apply its own pricing logic and then distribute the resulting stream to clients.
That means there is no requirement for every retail platform to receive exactly the same sequence of ticks at exactly the same millisecond.
TradeOG’s article How Broker Price Feeds Are Built From Liquidity Providers explains how liquidity-provider quotes can pass through aggregation and broker pricing before reaching a retail trading platform.
In fast markets, these differences can become more visible because prices are changing quickly and liquidity conditions can shift.
News Releases Can Make Tick Differences More Visible
Major economic releases are a good example.
During a high-impact event, price can move rapidly, spreads can change and quote updates can arrive at a much higher frequency. One broker may record a particular extreme quote while another does not.
The result can be different candle highs, lows and wick lengths.
This does not automatically mean that a broker manipulated a candle. The correct first step is to compare the underlying feed, timestamp, Bid/Ask data and market conditions before drawing conclusions.
How Tick Data Can Change a Breakout Candle
Suppose resistance is at 1.08440.
Feed A records a high of 1.08439. The candle never technically trades above the level on that chart.
Feed B records a tick at 1.08443. The candle now has a small wick above resistance.
A trader using Feed B might describe the move as a liquidity sweep or breakout attempt. A trader using Feed A might describe it as a test of resistance.
The underlying market may have been extremely close to the level in both cases. The difference is that the recorded tick stream produced a different visible extreme.
This is why a candle should be interpreted together with the data source and broader price structure rather than treated as an unquestionable record of a universal forex price.
Why Tick Data Matters More on Lower Timeframes
Tick differences become increasingly important as the timeframe gets smaller.
| Timeframe | Impact of Small Tick Differences |
|---|---|
| 1 minute | Very high visual impact |
| 5 minutes | High, especially around extremes |
| 15 minutes | Moderate in normal conditions |
| 1 hour | Usually less noticeable visually |
| Daily | Small feed differences are generally less important for the overall shape |
This does not mean tick data is irrelevant on higher timeframes. It means a small price discrepancy becomes a smaller percentage of the total candle range as the timeframe expands.
Why Scalpers Should Pay Attention to Tick Data
Scalpers operate with relatively small targets, so a tiny difference in entry, spread, high, low or execution can matter more than it would to a swing trader.
For example, if a strategy targets only a few points, a small feed difference can alter whether a setup appears to have broken a level, whether a stop was touched, or whether a candle closed beyond a trigger.
This is also why backtesting with unrealistic tick assumptions can create misleading results.
MetaTrader 5 provides an “Every tick based on real ticks” testing mode using real ticks accumulated by brokers. Its documentation describes this as a mode designed to provide conditions close to real trading conditions, while simplified modes use fewer price points. MetaTrader 5 Real and Generated Ticks documentation and Strategy Testing documentation.
Real Ticks vs Generated Ticks in Backtesting
There is an important difference between using actual recorded tick history and generating ticks from minute-bar information.
If you only know the Open, High, Low and Close of a minute, you know the endpoints and extremes but not the exact path price took between them.
For example, a candle with:
- Open: 1.08420
- High: 1.08450
- Low: 1.08390
- Close: 1.08430
could have moved from the Open to the High first and then fallen to the Low. Or it could have fallen to the Low first and then rallied to the High. The final OHLC values are identical, but the intrabar sequence is completely different.
That sequence can matter for strategies involving stops, limit orders, trailing logic and multiple entries.
MetaTrader’s documentation explicitly notes that real-tick testing can capture changing spreads within a minute, while generated ticks based on minute data simplify the intrabar sequence. MetaTrader 5 Real and Generated Ticks documentation.
Can Tick Data Change the Candle Direction?
Yes, but only when the underlying opening and closing prices differ between the data streams or chart construction rules.
For example, one feed may record the first relevant price at 1.08420 and the final price at 1.08430, producing a bullish candle. Another feed could begin with a slightly different quote or use a different price stream and end at a lower value, producing a bearish or neutral candle.
Small differences are more likely to affect the candle’s exact shape than its broad direction, but around session opens, news events and illiquid periods, the effect can become more visible.
What Traders Should Check When Two Candles Look Different
Before assuming something is wrong, check these factors:
- Same broker? Compare the candles using the same price feed if possible.
- Same symbol? Broker symbols can have different contract specifications and feeds.
- Same timeframe? Confirm both charts are exactly M1, M5, M15 or another identical period.
- Same timezone? A session boundary can change which ticks belong to a candle.
- Bid or Ask? Confirm what price stream the chart uses.
- Same historical data? Downloaded history can differ from another platform’s history.
- News event? Extreme volatility can make feed differences much more obvious.
- Spread conditions? A changing spread can affect executable prices even when the visible candle is similar.
Tick Data vs Candle Data: The Simple Difference
| Feature | Tick Data | Candle Data |
|---|---|---|
| Granularity | Individual price updates | Compressed time interval |
| Shows exact sequence | Yes, subject to feed completeness | No |
| Shows OHLC | Can be used to derive it | Yes |
| Useful for scalping | Very useful | Useful but less detailed |
| Storage requirement | Large | Much smaller |
| Backtesting detail | Highest with reliable real ticks | Lower |
How Indian Forex Traders Can Use This Information
For traders in India who use short-term forex or XAU/USD charts, the practical lesson is simple: do not compare candle shapes across platforms without first checking the data source.
If you use a broker’s MT5 feed for execution, that feed should be your primary reference for broker-specific levels, spreads and execution behaviour. A different charting platform can still be useful for analysis, but its highs and lows should not automatically be treated as identical to the broker’s executable market.
This becomes particularly important when reviewing a stop-loss event or claiming that price “never touched” a level. The visible chart may not contain every quote that influenced execution, and Bid/Ask differences can matter.
For more on execution discrepancies, see Why XAU/USD Can Hit Your Stop Loss Without Breaking the Candle Low.
How to Avoid Misreading Tick-Based Candle Differences
- Use the same broker feed when testing an execution-based strategy.
- Do not treat every wick as proof of manipulation.
- Compare Bid and Ask when investigating stops or entries.
- Use real tick data where possible for serious backtesting.
- Be especially careful with M1 and other very short timeframes.
- Expect greater discrepancies during major news and rapid market moves.
- Keep your chart timezone consistent when comparing platforms.
- Record the broker, symbol and timeframe when collecting historical screenshots.
Frequently Asked Questions
Does every tick become part of a candle?
Every relevant price update contributes to the price path from which a bar can be formed, but the finished candle only exposes its summarized OHLC values rather than every tick.
Why does my broker show a different wick?
The broker may have received a different sequence of quotes or use a different pricing feed. A single additional high or low can change a wick.
Is tick volume real forex volume?
No. Tick volume counts price updates received by the platform. In OTC forex, it should not automatically be interpreted as the actual number of lots traded.
Should I use tick data for scalping?
It can be useful for understanding intrabar behaviour and for realistic backtesting, but tick data does not create a trading edge by itself. Execution quality, spread, liquidity and strategy design still matter.
Can two brokers have different candle highs and lows?
Yes. Different liquidity sources, pricing systems, timestamps and quote streams can result in different recorded extremes.
Final Takeaway
A forex candle is a summary of price activity, not a complete recording of everything that happened inside the timeframe. Tick data sits underneath that summary and determines the path from which the Open, High, Low and Close are constructed.
That is why a small difference in tick history can change a wick, alter a breakout level, change the apparent strength of a rejection or make two broker charts look slightly different.
The practical rule is straightforward: when a candle matters for a short-term trading decision, always consider the underlying price feed, Bid/Ask structure, timeframe and tick history. The more precise the strategy, the more important the quality and consistency of the underlying data becomes.