Quick answer: An inside bar is a two-candle price-action pattern in which the second candle trades completely inside the high-low range of the previous candle, known as the mother bar. It shows short-term consolidation or compression. Traders commonly watch for a breakout above the mother bar high or below its low, then use the broader trend, support and resistance, volatility and risk management to decide whether the breakout is worth trading.
The pattern looks simple, but the important part is not spotting two candles. The real edge comes from understanding where the inside bar formed, what the market was doing before it appeared, and whether the eventual breakout has enough momentum to follow through.
What Is an Inside Bar?
An inside bar is formed when the high of the current candle is lower than the high of the previous candle and its low is higher than the low of the previous candle. The previous candle is commonly called the mother bar.
In simple terms, the entire range of the inside bar sits inside the range of the mother bar. The inside bar does not have to sit inside the mother bar’s body; its wicks are included in the comparison. This distinction matters because traders sometimes incorrectly identify candles that are only inside the previous candle’s real body.
| Part | What it means |
|---|---|
| Mother bar | The larger preceding candle that defines the range. |
| Inside bar | The smaller candle whose high and low remain inside the mother bar. |
| Mother high | Common upside breakout reference. |
| Mother low | Common downside breakout reference. |
| Compression | A pause in price movement before a possible expansion. |
This is why the pattern is often described as a volatility contraction followed by potential expansion. The pattern itself does not predict direction. Direction comes from context and the eventual price break.
How to Identify an Inside Bar on a Chart
Use a mechanical test before calling something an inside bar:
- Identify the previous candle and mark its high and low.
- Check whether the next candle’s high is below the mother bar high.
- Check whether the next candle’s low is above the mother bar low.
- If both conditions are true, you have a conventional inside bar.
- Mark the mother bar high and low because those levels become the main breakout references.
Some traders allow equal highs or equal lows under a looser definition. For a clean trading plan, however, it is better to define your own rule in advance rather than changing the definition from trade to trade.
Why Does an Inside Bar Form?
Markets rarely move in a straight line. After a strong directional candle, traders may pause to reassess price, take partial profits, wait for economic data or simply reduce activity. That temporary balance can create a smaller candle inside the previous range.
Think of the mother bar as the area that established a relatively wide battlefield. The inside bar shows that price has not yet escaped that battlefield. Once price breaks the boundary, traders receive new information about which side is taking control.
That is why inside bars are often more useful as breakout structures than as standalone buy or sell signals.
Inside Bar Bullish Breakout
A bullish inside bar setup generally occurs when price is already showing upward strength or the pattern forms near a meaningful support or demand area. Traders then watch the mother bar high.
For example, imagine EUR/USD is trending higher. A large bullish candle forms from 1.1700 to 1.1740. The next candle trades between 1.1715 and 1.1732. The second candle is inside the first candle’s range. A trader may define 1.1740 as the breakout level.
If price breaks above 1.1740 with convincing follow-through, the inside bar has resolved upward. That does not guarantee a profitable trade. A breakout can fail immediately, particularly when the pattern forms directly under resistance or during thin liquidity.
Inside Bar Bearish Breakout
The bearish version is the mirror image. If the broader market is weak, traders may watch the mother bar low for a downside break.
Suppose XAU/USD sells off sharply and then forms an inside bar beneath a broken support level. If the mother bar low is $2,410 and price later breaks and holds below that level, the setup may provide a continuation entry for a trader who already has a bearish thesis.
The important point is that the inside bar is providing a defined decision area. It is not magically forecasting the next candle.
Inside Bar Continuation vs Reversal
There are two major ways traders use the pattern.
| Setup | Context | Typical idea |
|---|---|---|
| Trend continuation | Strong existing trend | Trade the breakout in the direction of the trend. |
| Reversal | Key support or resistance | Use the breakout as confirmation that control may be changing. |
For newer traders, continuation setups are usually easier to structure because the trader is not asking a single small pattern to call the exact market top or bottom. A strong trend provides additional context.
How Traders Actually Trade an Inside Bar
A common mechanical approach is to use the mother bar’s high and low as trigger levels.
Method 1: Breakout Entry
A trader waits for price to break above the mother high for a long setup or below the mother low for a short setup. The trade is then managed using a predefined stop and target.
This approach has one major advantage: the market has to prove that it can leave the compression range before the trader commits capital.
Method 2: Candle-Close Confirmation
Instead of entering as soon as price touches the breakout level, a trader waits for the candle to close beyond the mother bar. This can reduce some false breaks but may produce a worse entry price.
There is no universal best method. The correct choice depends on the instrument, timeframe, volatility and testing results.
Method 3: Retest Entry
Some traders wait for the breakout and then look for price to retest the broken mother-bar boundary. If the old resistance behaves like support in a bullish breakout, or old support behaves like resistance in a bearish breakout, the retest can offer a more structured entry.
The trade-off is obvious: a strong breakout may never retest, leaving the trader without an entry.
Where Should the Stop Loss Go?
Stop placement should be based on market structure rather than an arbitrary number of points.
For a bullish inside-bar breakout, some traders place the stop below the inside bar low, while others use the mother bar low or a nearby structural swing. A tighter stop reduces the amount at risk per unit but is also easier for normal market noise to hit.
For a bearish setup, the same logic applies in reverse.
| Stop approach | Advantage | Risk |
|---|---|---|
| Below/above inside bar | Very tight invalidation | More vulnerable to noise. |
| Below/above mother bar | More room for volatility | Larger stop distance. |
| Beyond market structure | Linked to actual thesis invalidation | Can require smaller position size. |
The stop should be selected first. Position size should then be calculated from the stop distance and the amount you are willing to lose. Do not choose a large position and then move the stop simply because the original risk feels uncomfortable.
Inside Bar Risk-to-Reward Example
Imagine a trader has a ₹1,00,000 account and is willing to risk 0.5%, or ₹500, on one trade.
An XAU/USD setup produces a 5-dollar stop distance. If the trader’s broker contract specification means one chosen position would lose ₹100 for every $1 move against the position, the position would expose ₹500 of risk at a $5 stop.
If the planned target is 10 dollars away, the theoretical reward-to-risk ratio is 2:1.
The calculation is more important than the exact numbers:
Risk amount = Account equity × Risk percentage
Position size = Risk amount ÷ monetary loss at the chosen stop
Always use your broker’s actual contract size, tick value and currency conversion when calculating XAU/USD or forex position size. You can also review TradeOG’s guide on pip value calculation for Indian forex traders.
Why Location Matters More Than the Pattern
An inside bar in the middle of random sideways price action is very different from an inside bar that forms after a strong trend at a well-defined market level.
Before trading one, ask:
- Is the market trending or ranging?
- Where is the nearest support?
- Where is the nearest resistance?
- Did a strong directional move occur immediately before the pattern?
- Is the inside bar forming near a previous high or low?
- Is important economic news approaching?
- Is current volatility normal for the instrument?
This is the difference between pattern recognition and trade analysis.
Inside Bars in Trending Markets
Inside bars can be useful during strong trends because a market does not necessarily need a deep pullback before continuing. A short pause can give traders a defined breakout structure.
In an uptrend, look for higher highs and higher lows. If price pauses and creates an inside bar without destroying the broader structure, an upside breakout may fit the trend thesis.
In a downtrend, look for lower highs and lower lows. An inside bar below a meaningful swing can provide a similar continuation framework.
However, never assume that every inside bar in a trend should be traded. A trend can be exhausted, and late-stage breakouts can have poor reward relative to risk.
Inside Bars at Support and Resistance
An inside bar can become more interesting when it forms at a level that already matters.
For example, price may fall into established support and print a strong rejection candle followed by an inside bar. If price then breaks above the inside structure, the pattern is giving additional confirmation to the support thesis.
Likewise, an inside bar below resistance can become a bearish continuation or reversal setup if sellers regain control.
The level comes first. The candle pattern comes second.
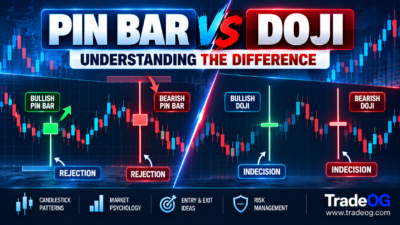
Inside Bar vs Doji: They Are Not the Same
Both patterns can indicate hesitation, but they describe different things.
| Feature | Inside Bar | Doji |
|---|---|---|
| Definition | Based mainly on relationship between two candle ranges. | Based mainly on open and close being close together. |
| Mother candle required? | Yes, for the standard definition. | No. |
| Main information | Compression within a previous range. | Balance or indecision within one candle. |
| Typical breakout reference | Mother bar high/low. | Depends on context. |
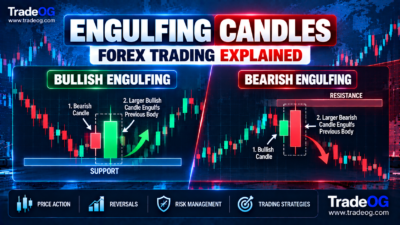
Inside Bar vs Engulfing Pattern
An engulfing pattern describes a candle that overtakes the prior candle’s body under commonly used definitions. An inside bar does almost the opposite: the second candle is contained within the prior range.
One shows expansion relative to the previous body, while the other shows contraction relative to the previous range. They can therefore provide very different information about immediate market behavior.
Multiple Inside Bars: The Coiling Effect
Sometimes two or more smaller candles form inside the same mother bar. This is often called a multi-inside-bar or coiling structure.
The practical idea is simple: price remains trapped inside a defined range for longer. Traders can continue to monitor the mother-bar boundaries, but the longer consolidation does not automatically mean the eventual breakout will be stronger.
Multiple inside bars can also produce false confidence. The market may break one small boundary, reverse, and only later break the actual mother range. This is why defining exactly which range controls the setup is important.
Inside Bar False Breakouts
One of the biggest mistakes is treating the first price spike beyond the mother bar as guaranteed continuation.
Imagine the mother high is 2,500 on gold. Price briefly trades at 2,502, triggers breakout buyers, then quickly falls back inside the mother range. If the market later breaks the opposite side, the initial move was a failed breakout.
False breaks are especially important around obvious highs and lows, major news events and thin liquidity. Traders studying price action often use this behavior as a separate setup rather than assuming every breakout will follow through.
For a broader discussion of breakout behavior and market structure, see TradeOG’s guide to forex market depth and liquidity and the site’s coverage of XAU/USD London-session behavior.
Using Inside Bars on XAU/USD
Gold is a useful market for studying inside bars because XAU/USD can alternate between compression and sharp expansion. But that same characteristic creates execution risk.
A small inside bar during a quiet period may look attractive, while an inside bar immediately before major US economic data can be much less predictable. A breakout can travel rapidly in either direction, spreads can change and slippage can increase.
Indian traders should also remember that the international XAU/USD price is only part of the local picture. USD/INR can affect the rupee value of gold-related positions, while local products such as MCX Gold have their own contract and trading-session characteristics.
TradeOG’s USD/INR and gold correlation guide explains why the rupee exchange rate deserves attention when analysing gold from an Indian perspective.
Which Timeframe Is Best for Inside Bars?
There is no single timeframe that makes the pattern profitable. However, higher timeframes generally produce fewer signals and can make the market context easier to interpret.
| Timeframe | Typical use | Main issue |
|---|---|---|
| Daily | Major trend and swing setups | Fewer opportunities and wider stops. |
| 4-hour | Swing and active trend trading | Still requires patience. |
| 1-hour | Day-trading structure | More noise and false breaks. |
| 15-minute | Intraday setups, including XAU/USD | Many low-quality patterns. |
| 5-minute | Very short-term execution | High noise and execution sensitivity. |
If you trade 15-minute XAU/USD, do not treat every inside bar as a signal. A better process is to use a higher timeframe for directional context, then use the lower-timeframe pattern as an entry structure.
A Simple Inside Bar Strategy for Beginners
A straightforward rules-based framework can look like this:
- Identify the higher-timeframe trend.
- Mark important support and resistance.
- Wait for a clear mother bar followed by an inside bar.
- Prefer patterns that agree with the broader market structure.
- Mark the mother bar high and low.
- Wait for a predefined breakout condition.
- Place the stop at a logical invalidation point.
- Calculate position size from the maximum acceptable loss.
- Define the target before entering.
- Record the trade outcome and the quality of the setup.
The last step is often ignored. A trader should track whether the pattern worked because of trend alignment, key-level confluence, session timing or simply random price movement.
How to Filter Low-Quality Inside Bars
Consider rejecting the setup when several warning signs appear at once:
- The market is completely directionless.
- The pattern forms directly into strong resistance or support.
- The mother bar is unusually large and makes the stop impractical.
- Major economic news is about to be released.
- The breakout occurs on a very thin market.
- The potential reward is too small relative to the stop.
- The setup requires you to chase a candle that has already moved far beyond the trigger.
- Your position size would have to be increased just to make the trade worthwhile.
Filtering is important because the goal is not to trade more inside bars. The goal is to trade fewer setups with a clearly defined reason for participation.
Inside Bar and News Trading
An inside bar can appear just before CPI, NFP, FOMC decisions or another major event. The compressed range may look like a perfect breakout setup, but the news can produce a violent move in both directions.
For gold traders, this matters particularly around major US data. Review TradeOG’s article on why gold moves during US economic data releases before treating a news-adjacent candle pattern as a normal technical setup.
If your strategy has not been tested during high-impact releases, the safer choice may be to wait for the initial volatility to settle rather than assuming the inside-bar breakout will behave normally.
Common Inside Bar Trading Mistakes
1. Trading Every Inside Bar
Pattern frequency is not the same as opportunity quality. A chart can contain many inside bars with no meaningful directional edge.
2. Ignoring the Mother Bar
The mother bar defines the main range. Focusing only on the small candle can lead to poor breakout decisions.
3. Entering Before the Trigger
Anticipating the breakout can turn a defined setup into a prediction. If your rules require a breakout, wait for the breakout condition.
4. Using the Same Stop on Every Instrument
EUR/USD, gold and index futures do not move in the same way. Stops should reflect the instrument’s volatility and structure.
5. Moving the Stop After Entry
If the original setup becomes invalid, moving the stop simply to avoid taking the loss changes the strategy. Decide invalidation before entry.
6. Ignoring Session Context
A breakout during an active global session may behave differently from one occurring during a quiet period. For XAU/USD, session liquidity and US data can materially affect the quality of a short-term setup.
Inside Bar Trading Checklist
- Is the second candle completely inside the mother-bar range?
- What is the higher-timeframe trend?
- Where are the nearest support and resistance levels?
- Is the setup continuation or reversal?
- What are the mother high and mother low?
- What exactly triggers the entry?
- Where is the trade invalidated?
- What is the maximum rupee amount I can lose?
- Does the reward justify the risk?
- Is major news approaching?
- Is the current session liquid enough for the strategy?
- Am I following a tested rule or simply reacting to the chart?
Frequently Asked Questions
Is an inside bar bullish or bearish?
Neither by itself. It is primarily a consolidation pattern. The breakout direction and surrounding market context determine whether traders interpret it as bullish or bearish.
Does the inside bar have to be smaller than the mother bar?
Under the standard definition, its entire high-low range must be contained within the mother bar. This normally makes it visually smaller, although the exact candle body size is not the defining condition.
Can there be more than one inside bar?
Yes. Multiple inside bars can form within a single mother-bar range. This is often viewed as additional compression, but it is not a guarantee of a larger breakout.
Is an inside bar a reliable strategy?
No candlestick pattern is reliable in isolation. Its usefulness depends on market regime, timeframe, instrument, execution, risk management and the rules used to filter and trade it.
Can I use inside bars on XAU/USD?
Yes, but gold’s volatility means traders should pay close attention to position size, spread, slippage, session conditions and major US economic releases.
Should beginners trade inside bars on 5-minute charts?
It is usually easier to learn the structure on higher timeframes because lower-timeframe charts contain more noise and more false signals. If you eventually use 5-minute or 15-minute setups, test the exact rules rather than assuming a daily-chart concept behaves identically intraday.
Final Takeaway
An inside bar is simple to recognize: the second candle sits inside the high-low range of the previous mother bar. The difficult part is deciding whether that compression actually matters.
The strongest way to use the pattern is to combine it with market structure, trend direction, support and resistance, volatility, session context and disciplined position sizing. Treat the mother-bar boundaries as decision levels rather than guaranteed signals, and remember that a breakout can fail.
For Indian traders, the same principle applies to forex and XAU/USD: a clean chart pattern is only one piece of the trade. Execution conditions, instrument volatility, currency conversion and event risk still matter.
If you are building a price-action system, start by collecting a meaningful sample of inside bars, classify them by trend and location, and measure the results. A tested process is far more valuable than memorising a candlestick shape.
Sources & Further Reading
- IG: Candlestick patterns and inside bars
- PriceAction.com: Inside Bar Trading Strategy
- PriceAction.com: Price Action Breakout Strategies
Risk disclaimer: Trading leveraged financial markets involves substantial risk and is not suitable for every trader. A chart pattern, including an inside bar, does not guarantee a profitable outcome. Use appropriate position sizing, understand your broker or exchange’s contract specifications, and trade only with capital you can afford to lose.