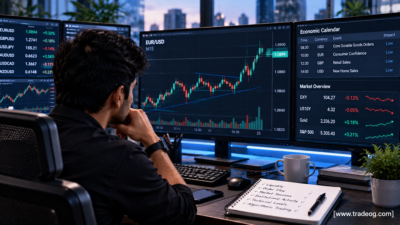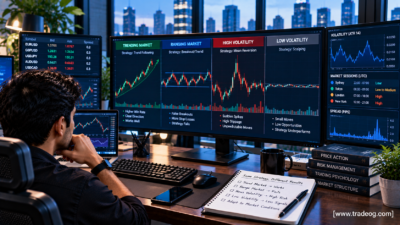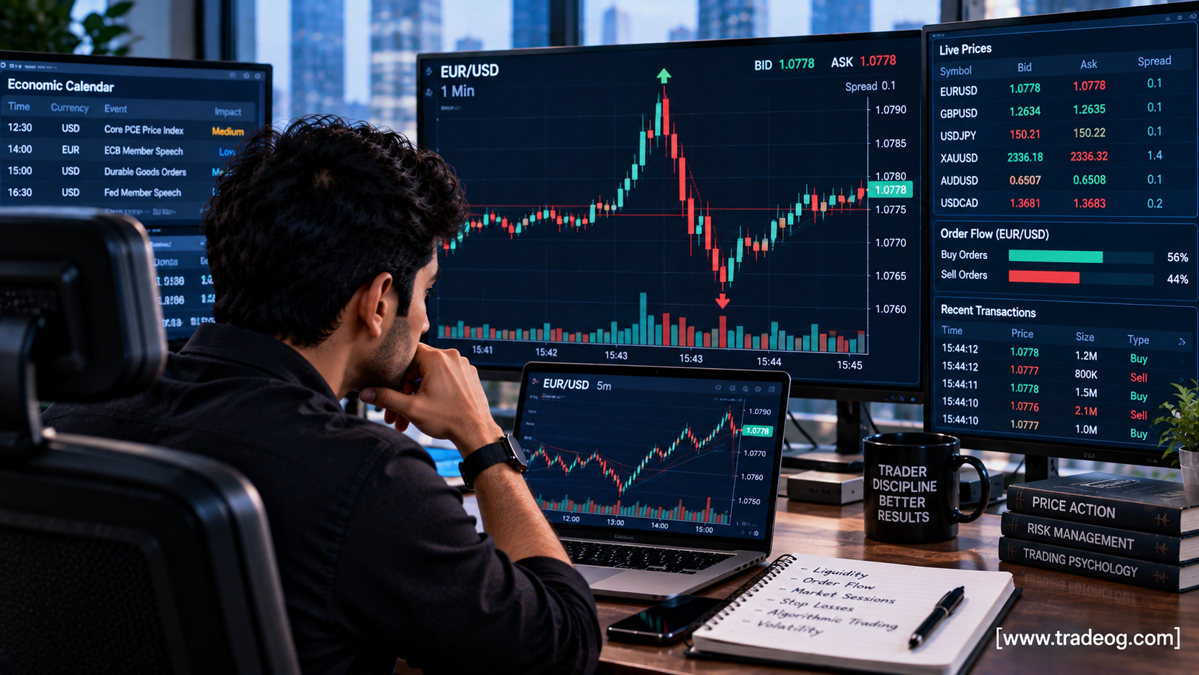
Have you ever watched EUR/USD, GBP/USD or USD/JPY move strongly in one direction and then suddenly reverse within a few seconds? The first move can look like a breakout, only for the next few candles to erase it almost immediately.
This is one of the most confusing things for newer forex traders. They may think, “If the market was bullish five seconds ago, why did it suddenly become bearish?” The answer is that short-term forex prices are constantly responding to changing orders, liquidity, spreads, positioning and execution conditions.
Forex does not need a brand-new headline every time price changes direction. The FX market is decentralised and fragmented, with trading taking place across dealers and multiple electronic venues. Much of the trading is also not directly visible to retail traders. That structure helps explain why price can reverse extremely quickly even when the economic calendar has not changed.
Why Can Forex Prices Move in Opposite Directions Within Seconds?
The simplest explanation is that the balance between buyers and sellers can change faster than a retail chart makes obvious.
Imagine EUR/USD jumps from 1.0770 to 1.0780. Buyers may appear to be in control. But if that move reaches an area containing sell orders, profit-taking, stop orders and limited liquidity, the buying pressure can disappear. Sellers can then become more aggressive and push price back down.
The sequence can look like this:
Buying pressure increases → price jumps → liquidity changes → stops/orders are triggered → selling pressure increases → price reverses.
Nothing about this requires a new economic announcement.
1. Forex Is a Two-Sided Market
A currency pair is always a relative price. When you buy EUR/USD, you are effectively buying euros and selling US dollars. When you sell EUR/USD, you are doing the opposite.
That means there is always a battle between opposing flows.
A trader may see a green candle and assume the entire market has become bullish. In reality, that candle only tells you that transactions occurred at progressively higher prices during that period.
Those conditions can change quickly.
A large buyer may finish executing. A bank may adjust its inventory. Short sellers may enter near resistance. Existing longs may take profit. A technical level may attract new orders. An algorithm may change its execution pattern.
Once the balance changes, price can move in the opposite direction.
2. Liquidity Can Disappear or Become Thinner
One of the most important concepts behind sudden reversals is liquidity.
Liquidity describes how easily trades can be executed without moving the market significantly. Bid-ask spreads, market depth and price impact are among the measures used to understand liquidity.
When liquidity is deep, a particular amount of buying or selling may have a relatively small effect. When liquidity is thinner, the same flow can move price much more aggressively.
This matters because liquidity is not fixed.
It can change around:
- Major market session opens
- Economic announcements
- Central-bank events
- Market holidays
- Large option expiries or institutional flows
- Sudden volatility
- Periods when liquidity providers reduce risk
The BIS describes FX liquidity as dynamic and notes that market depth and price impact can change as trading conditions change. That is why a rapid reversal should not automatically be interpreted as a completely new fundamental trend.
3. A Breakout Can Trigger Orders in Both Directions
Suppose EUR/USD has been trading below 1.0800 for several hours.
Many traders may consider 1.0800 an important resistance level. Some place buy-stop orders above it, expecting a breakout. Others already hold short positions and place stop-losses around the same area.
Price moves above 1.0800.
Those buy orders can add upward pressure. The breakout looks convincing.
But once the available orders above the level are consumed, the market can run into fresh selling. If buyers fail to continue, price can fall back below 1.0800.
This creates the classic pattern:
Breakout → fast continuation → rejection → reversal.
Retail traders often call this a false breakout. It is important to understand that a false breakout does not necessarily mean someone deliberately “hunted” traders. It can be a normal consequence of how orders and liquidity are distributed around an important level.
4. Stop-Losses Can Make a Reversal Much Faster
Stop-loss orders can turn an ordinary change in direction into a fast price movement.
Imagine many traders are long EUR/USD after a breakout. Their protective stops may sit below the breakout level.
If price starts falling and reaches those stops, the stops can become market orders. That adds selling pressure.
More selling pushes price lower, potentially triggering more stops.
The result can become a cascade:
Initial reversal → stops trigger → additional selling → more stops trigger → accelerated decline.
The same process can happen in the opposite direction when short positions are forced to cover.
This is why a forex pair can appear to change its mind almost instantly.
5. Short Covering Can Create a Sudden Move Up
A sharp upward reversal does not always mean that new buyers suddenly became extremely bullish.
Sometimes existing short sellers are simply closing losing positions.
Suppose GBP/USD has been falling and many traders are short. Price reaches a major support level and stops falling. Some sellers close their positions to protect profits or reduce risk.
If price begins rising, traders with short positions may become uncomfortable. More shorts close.
Those buy orders push price higher, which can force additional short covering.
This can create a rapid upward move even without a major bullish headline.
The same concept works in reverse for long positions during a sharp sell-off.
6. Bid and Ask Prices Matter More Than Beginners Realise
Forex charts are often viewed as if there is only one price. In actual trading, there is a bid and an ask.
The difference between them is the spread.
During normal liquid conditions, the spread may remain relatively tight. During fast markets or thinner liquidity, the spread can widen.
This can create confusion when traders compare their entry or stop level with a chart price.
For example, a trader might see price apparently touch a level on a chart while the executable bid or ask behaves differently. Depending on whether the trader is buying or selling, the relevant side of the quote can matter for execution and stop activation.
For more on the cost side of execution, see our guide to forex commissions versus spreads.
7. Algorithms Can React Faster Than Human Traders
Modern FX markets are highly electronic. Banks and other market participants use execution algorithms to split orders, manage execution and respond to changing market conditions.
These systems can react to price, liquidity and order conditions much faster than a human trader can click a mouse.
The BIS has documented the increasing use of execution algorithms in the fragmented FX market and notes that algorithmic execution can improve matching efficiency while also introducing risks such as self-reinforcing price moves.
This matters for retail traders because a move that looks like a single enormous candle may actually be the visible result of many rapid transactions and execution decisions occurring across venues.
8. Cross-Market Moves Can Change Forex Direction
A currency pair does not exist in isolation.
Forex traders often watch:
- US Treasury yields
- Dollar Index or broader USD performance
- Equity indexes
- Gold
- Oil and other commodities
- Interest-rate expectations
- Volatility indicators
Suppose USD/JPY is rising because US yields are moving higher. If Treasury yields suddenly stop rising or reverse, USD/JPY can also lose momentum.
Likewise, EUR/USD may initially fall because the dollar strengthens, but if broader dollar demand suddenly fades, EUR/USD can reverse.
The forex chart may be the final place where the change becomes obvious even though the original driver came from another market.
9. Market Expectations Can Change Before the News Changes
Forex prices respond not only to actual information but also to changing expectations.
Suppose traders expect a central bank to cut interest rates at its next meeting. The currency may already reflect much of that expectation.
If new information changes the perceived probability of the cut, traders can adjust positions immediately.
There may be no single “breaking news” headline at the exact second of the reversal. The market can simply be repricing the probability of future outcomes.
This is one reason experienced traders pay attention to interest-rate expectations, bond yields and broader market positioning rather than relying only on an economic calendar.
10. Profit-Taking Can Reverse a Strong Candle
Sometimes the simplest explanation is that traders are taking profits.
Imagine EUR/USD has climbed 70 pips during the session. Traders who bought earlier now have profitable positions.
As price reaches a target or resistance area, some of those traders sell to lock in gains.
If new buyers are not strong enough to absorb that selling, the pair can reverse.
This does not necessarily mean the bullish trend is over. It may simply be a temporary correction.
11. Technical Levels Can Cause Immediate Rejection
Markets often react around areas where traders are watching the same price.
These may include:
- Previous day high and low
- Weekly high and low
- Round numbers
- Previous session highs and lows
- Major support and resistance
- Recent swing points
- Breakout levels
When price reaches one of these areas, different groups may act at the same time.
One group buys the breakout. Another group sells resistance. Existing traders take profit. Stop-losses are triggered. New traders enter after confirmation.
The combined effect can produce an aggressive move in one direction followed by an equally aggressive move in the other.
12. Why This Happens More Often on 1-Minute and 5-Minute Charts
The smaller the timeframe, the more visible short-term market noise becomes.
On a daily chart, a 10-pip reversal may barely matter. On a one-minute chart, the same move can look like a major trend reversal.
Lower timeframes expose traders to:
- Microstructure noise
- Bid-ask effects
- Short-term liquidity changes
- Stop-loss cascades
- Rapid algorithmic execution
- Short-term profit-taking
- False breakouts
This does not make lower timeframes useless. It simply means that traders need to understand what the timeframe is actually showing.
Example: EUR/USD Moves Up and Down Within 20 Seconds
Consider a simple example.
EUR/USD trades at 1.0770. A large wave of buying pushes it to 1.0780. Traders watching the breakout enter long positions.
Above 1.0780, however, there is significant selling interest. Earlier short sellers may have placed stop-losses around the same zone, while some existing longs begin taking profit.
The upward move loses momentum.
Price falls back to 1.0774. Some breakout traders close their positions. More selling enters. Price briefly touches 1.0770 again.
Then buyers return around the previous support area and price climbs back toward 1.0778.
To a beginner, this can look completely random.
But the sequence can be understood as:
Breakout buying → liquidity absorption → profit-taking → stop activation → reversal → support buying.
The market did not necessarily change its long-term view of the euro within 20 seconds. Short-term positioning simply changed.
How Indian Forex Traders Can Handle Fast Reversals
If you are trading from India, rapid reversals can be especially important when trading around major global sessions and US economic events.
Instead of reacting to every fast candle, use a structured checklist:
- Check the spread: Has the bid-ask spread suddenly widened?
- Check the economic calendar: Is a scheduled release or speech nearby?
- Check DXY: Is the dollar moving broadly?
- Check US yields: Are Treasury yields confirming the move?
- Mark liquidity levels: Did price just take a previous high or low?
- Look for confirmation: Did price hold the breakout or immediately return inside the range?
- Check the session: Is London or New York participation increasing?
- Reduce leverage when conditions become unstable: A fast market can produce larger-than-expected losses.
How to Tell a Real Breakout From a Fast Reversal
There is no perfect method, but several clues can help.
| Behaviour | Possible Interpretation |
|---|---|
| Price breaks a level and holds above it | Stronger breakout confirmation |
| Price breaks and immediately returns below | Possible false breakout |
| Large candle followed by immediate opposite candle | Possible rejection or liquidity event |
| Move supported by broader USD movement | Cross-market confirmation |
| Move occurs with widening spread | Potentially unstable liquidity |
| Price repeatedly rejects the same level | Strong opposing order interest may exist |
The key is not to predict every reversal. The goal is to avoid entering blindly when the market is showing unstable short-term conditions.
Is a Sudden Forex Reversal Market Manipulation?
Not automatically.
Retail traders often describe every sharp wick as manipulation or stop hunting. Sometimes liquidity around obvious levels can indeed make stop orders part of a rapid move, but a sudden reversal can also arise naturally from normal order matching, profit-taking, changing liquidity, cross-market moves and automated execution.
The modern FX market is fragmented across multiple venues and dealers. That means the complete order flow visible to one retail trader is only a small part of the global market.
A better approach is to ask what changed in liquidity, positioning and execution? rather than assuming an intentional attack on retail traders.
What Fast Opposite Moves Mean for Prop Firm Traders
Rapid reversals are particularly dangerous when trading a prop-firm account.
A trader may enter after a strong breakout, only to see the market reverse before the trade has enough room to develop. If the position is oversized, one or two fast reversals can consume a significant portion of the permitted drawdown.
For this reason, prop-firm traders should pay close attention to:
- Maximum risk per trade
- Daily drawdown limits
- Spread expansion
- News restrictions
- Slippage
- Position size
- Distance to technical invalidation
A good setup can still lose. Risk management determines how damaging that loss becomes.
Common Mistakes Traders Make During Rapid Reversals
Chasing the first candle
A large candle often attracts traders after much of the initial move has already happened. Entering late can leave very little room before the market retraces.
Moving the stop after entry
When price reverses, traders sometimes widen their stop because they believe the original idea will eventually work. This can turn a controlled loss into a much larger one.
Calling every wick manipulation
A wick can result from normal liquidity and order-flow dynamics. It is not proof of deliberate manipulation.
Ignoring spread
Fast markets can produce wider spreads and different execution conditions. Always understand how your broker handles execution.
Using too much leverage
Leverage magnifies both winning and losing positions. A rapid reversal becomes much more dangerous when the position size is too large.
Final Takeaway
Why can forex prices move in opposite directions within seconds? Because the short-term FX market is constantly changing.
Liquidity can shift. Orders can be absorbed. Stop-losses can trigger. Short sellers can cover. Long traders can take profit. Algorithms can execute orders rapidly. Technical levels can attract opposing flows. Another market can change direction. Expectations can be repriced.
All of these forces can combine into a move that looks contradictory on a retail chart.
The important lesson is that one fast candle does not automatically represent a new fundamental trend. Before entering a trade after a sudden move, look at the broader market, liquidity, spread, technical level, session and confirmation.
Once you understand these mechanics, a sudden up-down-up or down-up-down sequence becomes less mysterious and much easier to manage.
Risk disclaimer: Forex and leveraged trading involve substantial risk. This article is for educational purposes only and is not financial advice. Trading decisions should be based on your own risk tolerance, broker conditions and applicable regulations.