Engulfing candles are among the most recognizable two-candle patterns in forex trading. They can show a sharp change in buying and selling pressure, especially when they form at important support or resistance levels after an extended move. But an engulfing candle is not a guaranteed reversal signal. Context, market structure, volatility and confirmation matter.
This guide explains engulfing candles for forex traders from the ground up. You will learn how bullish and bearish engulfing patterns form, what they mean, how to distinguish a high-quality setup from a weak one, where traders commonly place invalidation levels, how to combine engulfing candles with support and resistance, and how Indian forex traders can use them on intraday and higher timeframes.
What Is an Engulfing Candlestick Pattern?
An engulfing pattern is a two-candle price-action formation. The second candle is substantially larger than the first and its real body covers the previous candle’s real body. The two basic forms are bullish engulfing and bearish engulfing.
The pattern is important because it visually shows a change in short-term control. A bearish candle followed by a much stronger bullish candle suggests that buyers were able to overwhelm the selling pressure represented by the previous candle. The opposite happens with a bearish engulfing.
IG’s technical-analysis guidance describes engulfing patterns as two-bar formations commonly used to identify potential reversals, while also emphasizing that they are based on price action that has already occurred. In other words, an engulfing candle is a reaction signal, not a crystal ball.
Bullish Engulfing Explained
A bullish engulfing pattern normally consists of a smaller bearish candle followed by a larger bullish candle whose body engulfs the previous bearish body.
The classic interpretation is:
- The market has been declining or pulling back.
- Sellers remain in control during the first candle.
- The next candle opens around or below the previous body.
- Buyers step in aggressively.
- The second candle closes above the previous candle’s open, engulfing its real body.
The larger the second body relative to the first, the more obvious the change in short-term momentum can appear. However, candle size should always be considered relative to recent volatility.
What does a bullish engulfing tell traders?
It suggests that buying pressure has become stronger than the selling pressure seen in the previous candle. If it forms at a well-defined support zone after a meaningful decline, the pattern can provide evidence that sellers are losing control.
That does not mean price must immediately enter a sustained uptrend. A bullish engulfing in the middle of a sideways market can fail quickly, especially if there is resistance only a few points above it.
Bearish Engulfing Explained
A bearish engulfing pattern is the opposite. A smaller bullish candle is followed by a larger bearish candle whose real body engulfs the previous bullish body.
The classic sequence is:
- Price has been rising or pulling back upward.
- Buyers control the first candle.
- The next candle initially trades near or above the previous body.
- Sellers enter aggressively.
- The second candle closes below the previous candle’s open.
A bearish engulfing becomes more interesting when it appears near established resistance, after an extended rally, or following a failed breakout.
Engulfing Candle Rules: What Actually Counts?
There is some variation in how traders define an engulfing pattern. The most widely used interpretation focuses on the real body, not necessarily the entire high-to-low range.
| Feature | Bullish engulfing | Bearish engulfing |
|---|---|---|
| First candle | Usually bearish | Usually bullish |
| Second candle | Strong bullish candle | Strong bearish candle |
| Body relationship | Second body engulfs first body | Second body engulfs first body |
| Common context | After decline or at support | After rally or at resistance |
| Potential message | Buyers gaining control | Sellers gaining control |
| Confirmation | Structure, level, momentum | Structure, level, momentum |
Some traders require the second candle to engulf the entire range, including the wicks. That is a stricter definition, but it is not necessary for every practical price-action approach. The important point is to define your rules consistently before testing a strategy.
Why Engulfing Candles Matter in Forex
Forex is a highly liquid market where price can respond quickly to changes in expectations, interest rates, economic releases and order flow. Candlestick patterns compress this activity into a visual representation of open, high, low and close.
An engulfing pattern is useful because it compares two consecutive periods and highlights a sudden change in directional pressure.
Think of it as a short-term battle:
Candle 1: one side appears to have control.
Candle 2: the opposite side overwhelms that control.
The key question is what caused the change and whether the surrounding market structure supports the interpretation.
Engulfing Candle at Support
A bullish engulfing at support is one of the most common setups traders look for.
Imagine EUR/USD has been falling toward a previous swing low. Price reaches the support area and prints a small bearish candle. The next candle initially trades lower but buyers take control and close strongly above the previous candle’s open.
The pattern is more meaningful because the engulfing candle is reacting to a location where buyers have previously shown interest.
A practical framework is:
- Identify a clear support zone.
- Wait for price to reach the zone.
- Look for a bullish engulfing candle.
- Check whether the broader structure supports a bounce.
- Define the invalidation level.
- Only then evaluate the risk-to-reward opportunity.
Engulfing Candle at Resistance
The bearish equivalent occurs at resistance.
Suppose GBP/USD rallies into a previous swing high. A small bullish candle forms, followed by a large bearish candle that engulfs its body. The pattern tells you that sellers have become aggressive at a level where supply has previously appeared.
Again, the candle is evidence—not certainty. A strong market can temporarily reject resistance and then break through it later.
Engulfing Candles and Market Structure
One of the biggest mistakes beginners make is trading every engulfing candle they see.
A better approach is to ask where the pattern sits inside the market structure.
High-quality context
- Engulfing candle forms after a clear directional move.
- It appears at meaningful support or resistance.
- There is a liquidity sweep or failed breakout.
- The higher timeframe agrees with the setup.
- The second candle closes decisively.
- There is enough room to the next major level.
Weak context
- Pattern appears randomly in the middle of a range.
- Price is extremely choppy.
- The next resistance or support is very close.
- The candle is tiny relative to recent volatility.
- Major news is about to be released.
- The trader is entering solely because the candle “looks bullish” or “looks bearish.”
Bullish Engulfing Example
Consider a hypothetical EUR/USD setup.
| Step | Market observation |
|---|---|
| 1 | EUR/USD declines toward weekly support. |
| 2 | A small bearish candle forms at the level. |
| 3 | The next candle briefly trades lower. |
| 4 | Buyers push price above the previous candle’s open. |
| 5 | The candle closes as a bullish engulfing. |
| 6 | Trader waits for confirmation or a predefined entry rule. |
| 7 | Invalidation is placed below the relevant structure. |
The important part is not the candle alone. It is the combination of location + structure + momentum + risk.
Bearish Engulfing Example
Now consider USD/JPY after a strong rally.
| Step | Market observation |
|---|---|
| 1 | USD/JPY reaches a previous resistance area. |
| 2 | A small bullish candle forms. |
| 3 | The next candle pushes slightly higher. |
| 4 | Sellers take control. |
| 5 | The bearish candle closes below the previous candle’s open. |
| 6 | Price confirms or rejects the resistance zone. |
| 7 | Trader evaluates a short setup using predefined risk. |
Should You Enter Immediately After an Engulfing Candle?
There is no universal answer. Traders generally use one of three approaches.
1. Entry at the close
The trader enters as soon as the engulfing candle closes.
Advantage: earlier participation if the move continues.
Disadvantage: greater risk of entering before the market confirms the reversal.
2. Entry on a retracement
The trader waits for price to pull back toward the engulfing candle or a nearby level.
Advantage: potentially better entry location.
Disadvantage: the market may never retrace.
3. Entry after confirmation
The trader waits for the next candle or a structure break.
Advantage: additional evidence.
Disadvantage: later entry and potentially smaller reward-to-risk.
The best choice depends on the strategy and timeframe. The critical requirement is consistency so that results can be tested objectively.
Where Should the Stop Loss Go?
Stop placement should be based on trade invalidation, not an arbitrary number of pips.
For a bullish engulfing, traders may consider a level below the engulfing candle’s low or below the supporting market structure. For a bearish engulfing, a level above the engulfing candle’s high or relevant resistance can serve as an invalidation reference.
However, a wider stop is not automatically safer. Position size should be adjusted so that the amount at risk remains within the trading plan.
How to Set a Target
Possible target references include:
- Previous swing high or low
- Major support or resistance
- Range boundaries
- Liquidity zones
- Higher-timeframe levels
- Predefined risk-to-reward targets
Do not force a 1:3 or 1:5 target onto every engulfing pattern. If a major opposing level is directly ahead, the available room may be too small for the trade to make sense.
Engulfing Candles on Different Timeframes
| Timeframe | Typical use | Main challenge |
|---|---|---|
| 1–5 minute | Scalping and entry refinement | High noise and frequent false signals |
| 15 minute | Intraday forex trading | News and session volatility |
| 1 hour | Intraday/swing confirmation | Fewer setups |
| 4 hour | Swing trading | Larger stop distances |
| Daily | Higher-timeframe analysis | Fewer signals and longer holding periods |
A pattern generally becomes more meaningful when it reflects a larger amount of market information, but that does not make every daily engulfing profitable. Timeframe quality is not a substitute for context.
Engulfing Candles and Forex Sessions
Session timing can influence the quality of a candlestick signal.
During quieter periods, an engulfing pattern may have limited follow-through. During London or New York, increased liquidity and economic catalysts can produce much stronger moves—but also more slippage and volatility.
For Indian traders, it is useful to know how session behavior affects price action. See Forex Trading Sessions in IST: London, New York and Tokyo Explained.
Engulfing Candles During News
Major economic releases can create enormous candles that technically resemble engulfing patterns.
That does not necessarily make them high-quality reversal signals.
Suppose NFP causes EUR/USD to fall sharply and the next candle immediately engulfs the previous one. The apparent pattern may simply reflect a temporary reaction to changing liquidity or the second stage of the same news move.
Before trading an engulfing candle, check the economic calendar for events such as:
- FOMC decisions
- CPI
- NFP
- PCE inflation
- ECB decisions
- Bank of England decisions
- GDP releases
- PMI and ISM data
See Forex Economic Calendar: How Indian Traders Should Read It for a practical news-reading framework.
Can Engulfing Candles Be Used With RSI?
Yes. Some traders use RSI to provide momentum context.
For example, a bullish engulfing at support while RSI has been deeply weak may attract attention. A bearish engulfing at resistance while momentum is stretched may also be interesting.
But RSI should not be used as a mandatory confirmation if your tested strategy does not require it. Adding indicators simply because they look useful can make a strategy complicated without improving its expectancy.
Engulfing Candles With Moving Averages
Moving averages can help traders define the broader trend.
A bullish engulfing above a rising moving average can support a continuation interpretation, while a bearish engulfing below a declining average may align with bearish structure.
But avoid treating a moving-average crossover plus an engulfing candle as an automatic entry system. Price location remains important.
Engulfing Candles and Liquidity Sweeps
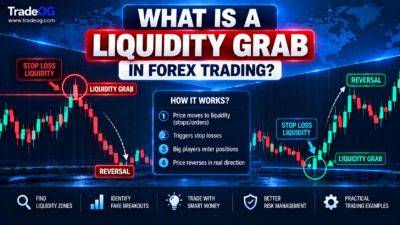
One particularly useful combination is a liquidity sweep followed by an engulfing candle.
Imagine price moves below a previous swing low, triggers stops and then rapidly closes back above the level with a bullish engulfing candle. The sequence can communicate:
- Liquidity below the low was taken.
- Sellers failed to maintain control.
- Buyers absorbed the selling pressure.
- Price closed back above the important level.
The bearish version can happen above a prior high before a sharp rejection.
This does not guarantee a reversal, but the pattern gives more context than an engulfing candle appearing randomly in the middle of a range.
Common Engulfing Candle Mistakes
1. Trading every engulfing pattern
There can be many engulfing candles on a lower timeframe. Most are not meaningful reversals.
2. Ignoring trend context
A bullish engulfing against a powerful higher-timeframe downtrend can be only a temporary bounce.
3. Entering before the candle closes
A candle that looks engulfing halfway through its formation can close as an ordinary candle. Pattern recognition should normally be based on completed candles.
4. Ignoring nearby resistance or support
A bullish signal directly underneath major resistance may have very little room to run.
5. Using a fixed stop for every setup
Market volatility changes. A fixed 10-pip or 20-pip stop does not have the same meaning across every pair and timeframe.
6. Confusing a large news candle with a reversal
High-impact releases can create unusual candle structures. Always understand what caused the move.
Engulfing vs Other Two-Candle Patterns
| Pattern | Basic structure | Typical message |
|---|---|---|
| Bullish engulfing | Small bearish + large bullish | Potential bullish reversal |
| Bearish engulfing | Small bullish + large bearish | Potential bearish reversal |
| Harami | Large candle + smaller opposite candle inside body | Potential loss of momentum |
| Tweezer bottom | Two candles with similar lows | Potential support/rejection |
| Tweezer top | Two candles with similar highs | Potential resistance/rejection |
The main distinction is decisiveness. An engulfing pattern shows the second candle overwhelming the prior body, while a harami is more about contraction and hesitation.
How Indian Forex Traders Can Use Engulfing Candles
Indian traders often focus on EUR/USD, GBP/USD, USD/JPY and gold-related markets while monitoring U.S. and European sessions. A practical workflow is to avoid scanning every pair continuously and instead create a short watchlist.
For a 15-minute setup, for example:
- Identify the 1-hour trend.
- Mark major support and resistance.
- Check the current trading session.
- Review the economic calendar.
- Wait for price to reach a meaningful level.
- Wait for the engulfing candle to close.
- Check whether the candle agrees with structure.
- Calculate position size from the stop distance.
- Define the target before entering.
- Record the trade in a journal.
This turns a candlestick pattern into a repeatable process rather than a visual guess.
Engulfing Candles and Risk Management
A strong-looking pattern can still fail. Therefore, risk management is more important than the visual quality of the candle.
Before entering, know:
- Entry price
- Invalidation price
- Position size
- Maximum account risk
- Target area
- News risk
- Spread and execution conditions
For traders using funded accounts, also check the firm’s current daily-loss, maximum-drawdown and news-trading rules. A technically valid setup is not worth taking if it violates the account’s restrictions.
See Forex Risk Management for broader position-sizing principles.
A Simple Engulfing Candle Trading Checklist
| Check | Question |
|---|---|
| Pattern | Does the second body clearly engulf the first? |
| Location | Is the pattern at meaningful support or resistance? |
| Trend | What is the higher-timeframe direction? |
| Liquidity | Was a recent high or low swept? |
| Momentum | Does the second candle show decisive pressure? |
| News | Is a high-impact release approaching? |
| Invalidation | Where is the trade idea objectively wrong? |
| Target | Is there enough room before the next major level? |
| Risk | Does the position size fit the trading plan? |
Are Engulfing Candles Reliable?
No candlestick pattern is reliable in isolation.
The probability of a useful signal generally depends on the market environment. An engulfing candle at a major level after a sustained move is very different from an engulfing candle that appears randomly during low-volatility consolidation.
The right question is therefore not “Does an engulfing candle work?” but “Under which conditions does my engulfing setup have positive expectancy?”
That question can only be answered properly by defining the setup and backtesting it over a meaningful sample of historical trades.
Final Takeaway
Engulfing candles are simple to recognize but difficult to trade well. A bullish engulfing shows buyers taking control over the previous bearish body, while a bearish engulfing shows sellers overwhelming the previous bullish body.
The strongest setups usually come from the combination of the pattern with market structure, meaningful support or resistance, liquidity behavior, momentum and sensible risk management.
For forex traders, the engulfing candle should be treated as a piece of evidence—not an automatic buy or sell button. Wait for the candle to close, understand the context, check the news, define invalidation and size the position according to risk.
FAQs About Engulfing Candles
What is an engulfing candle in forex?
An engulfing candle pattern is a two-candle formation where the second candle’s real body covers the previous candle’s real body. It can indicate a potential shift in short-term buying or selling pressure.
What is a bullish engulfing candle?
A bullish engulfing generally consists of a smaller bearish candle followed by a larger bullish candle whose body engulfs the previous bearish body. It is commonly interpreted as potential bullish reversal evidence, especially at support.
What is a bearish engulfing candle?
A bearish engulfing generally consists of a smaller bullish candle followed by a larger bearish candle whose body engulfs the previous bullish body. It is commonly watched near resistance or after an extended rally.
Which timeframe is best for engulfing candles?
There is no universally best timeframe. Higher timeframes can reduce noise, while 5-minute and 15-minute charts can provide more setups for intraday traders. Your rules should be tested on the timeframe you actually trade.
Can engulfing candles be used for scalping?
Yes, but lower timeframes produce more noise and false signals. Scalpers should combine the pattern with market structure, session timing, liquidity and strict risk controls.
Should I buy immediately after a bullish engulfing?
Not automatically. You can use close-entry, retracement or confirmation-based rules, but the choice should be part of a tested strategy rather than an emotional reaction to the candle.
Do engulfing candles work on XAU/USD?
They can be used on XAU/USD, but gold can move much faster than many major currency pairs. News, spreads, volatility and position sizing therefore require additional attention.
Sources and further reading: IG: Bullish and Bearish Engulfing Candlesticks, IG: Japanese Candlestick Trading Guide, and IG: Candlestick Patterns Every Trader Should Know.