

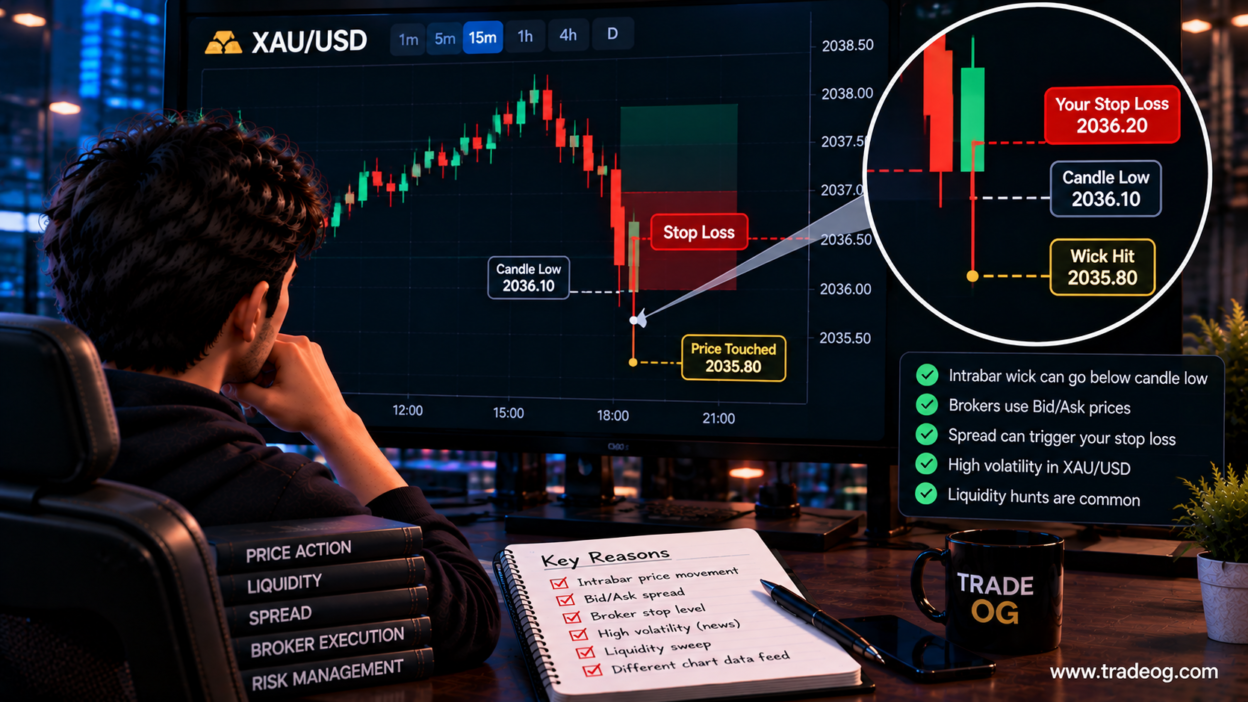
If you trade XAU/USD, you may have seen a frustrating situation: your stop loss is triggered, but when you look at the candle, the chart does not appear to have reached the level you expected. It can feel as if the broker stopped you out “early.”
In many cases, nothing unusual has happened to the stop itself. The confusion comes from the difference between the price displayed by the chart and the bid or ask price used to trigger and close your position. On gold, this difference can become more noticeable when spreads widen or price moves quickly.
This guide explains why an XAU/USD stop loss can be triggered even when the visible candle low or high appears not to have reached your level, how bid/ask pricing works, why spread matters, and how traders can diagnose the situation without assuming that a broker has manipulated the market.
The Short Answer
An XAU/USD stop loss can be triggered without the visible candle reaching your stop because the candle you see may be based on a different price stream from the price used to execute your trade.
For a typical long XAU/USD position, you buy at the ask and normally close at the bid. For a short position, you sell at the bid and normally close at the ask. The difference between those prices is the spread. OANDA explains that the applicable bid or ask price can determine whether a trade condition is reached, while some charts display a mid price or another price series. OANDA’s platform documentation also notes that charts can use mid, bid or ask prices depending on the platform and settings.
1. Your Chart May Not Show the Price That Triggered the Stop
This is the most important concept.
A candlestick is simply an aggregation of price observations during a period. The exact price represented by the candle depends on the data feed and chart settings. Your broker may execute a long position using the bid price while the chart you are watching displays mid prices.
Imagine a simplified XAU/USD example:
- Visible chart low: $2,036.30
- Your long-position stop loss: $2,036.20
- Bid price briefly reaches: $2,036.20
- Ask/mid price remains above the visible candle low level
Your stop can therefore trigger even though the candle on your screen does not visibly print a low at $2,036.20.
The opposite issue can happen with a short position because a short trade is normally closed using the ask price.
2. Bid and Ask Prices Matter More Than the Candle Alone
Every quoted market has a buying price and a selling price. The bid is the price at which the market is willing to buy, while the ask is the price at which the market is willing to sell. The difference is the spread. OANDA’s bid/ask explanation describes this distinction directly.
For a long trade:
Entry → Ask
Exit/stop → Bid
For a short trade:
Entry → Bid
Exit/stop → Ask
That means the price you see on a standard chart is not automatically the exact price that controls your stop.
3. A Wider Spread Can Make the Difference
Suppose XAU/USD is showing approximately:
Bid: $2,036.20
Ask: $2,036.35
The spread is $0.15.
If you are long and your stop is at $2,036.20, the bid can reach your stop while the chart’s displayed price remains higher, depending on what price series the chart uses.
This is why a trader can look at a candle and think, “The candle never touched my stop,” while the executable price actually did.
Spreads are not necessarily constant. OANDA notes that spreads can widen during periods of reduced liquidity and that wider spreads can trigger stop-loss orders. OANDA notes that spreads can widen during reduced liquidity and may trigger stop-loss orders.
4. XAU/USD Is Especially Sensitive During Fast Markets
Gold can move rapidly around major economic releases, central-bank communication, U.S. dollar moves, Treasury-yield changes and unexpected geopolitical headlines. During these periods, the available liquidity and spread can change quickly.
A stop that looked comfortably away from the visible price a few seconds earlier may become vulnerable when the market accelerates.
This does not automatically mean that the broker “hunted” your stop. A stop order is designed to react when the relevant trigger price reaches the specified level. OANDA and IG both explain that stop orders can become market orders once triggered, with execution potentially occurring at a different price during fast markets. OANDA explains stop-order execution and IG explains stop-loss slippage.
5. Candle Low Is Not the Same as Your Executable Low
Traders often compare their stop loss against the candle’s low or high as if both numbers came from exactly the same price stream. That assumption can be wrong.
Consider a long XAU/USD trade where your stop is $2,036.20. If the chart is displaying a mid-price candle and the bid briefly falls to $2,036.20, the trade can close while the displayed candle low remains above the stop.
The same principle works in reverse for short trades. A short stop can be triggered by an ask-price spike even if the visible candle high appears slightly below the stop.
Therefore, the correct question is not simply:
“Did the candle touch my stop?”
The better question is:
“Did the price series used by my broker to trigger the stop reach my stop level?”
6. Different Platforms Can Show Slightly Different Gold Prices
XAU/USD is not a single centralized exchange price in the same way a listed stock on one exchange may be. Retail brokers and CFD providers can quote gold using their own pricing arrangements, liquidity providers and spreads.
IG, for example, states that its spot-metal products use its own bid/offer spread based on the underlying market. IG explains its spot-metal bid/offer pricing.
This is why the same XAU/USD moment can look slightly different on two platforms. One chart may show a bid series, another may show mid prices, and another may provide bid/ask overlays.
If you are investigating a disputed stop-out, comparing a random screenshot from another platform is therefore not enough. You need to examine the actual broker’s price and execution records.
7. News and Liquidity Can Make the Difference Look Larger
During high-impact events, the spread can change quickly. A stop placed very close to the current market price has less room to absorb normal spread fluctuations.
This is especially important for traders using very tight stops on XAU/USD around events such as:
- U.S. inflation releases
- Nonfarm Payrolls
- Federal Reserve decisions and speeches
- Major U.S. economic data
- Unexpected geopolitical headlines
- Market opens, closes or periods of reduced liquidity
A wider spread does not mean every stop will be triggered. It means that the distance between the visible chart price and the executable bid/ask price can become more significant.
8. Slippage Is a Separate Issue
There are two different problems that traders often combine:
Problem 1: Triggering
The relevant bid or ask reaches the stop level.
Problem 2: Execution
After the stop is triggered, the position is filled at the next available market price, which can be better or worse than the stop level depending on market conditions.
These are not the same thing.
A stop loss generally does not guarantee an exact execution price. OANDA explains that once a stop loss is triggered, it becomes a market order, while IG similarly notes that fast markets can produce slippage. OANDA explains stop-order execution and IG explains stop-loss slippage.
9. How to Check Whether Your XAU/USD Stop Was Legitimately Triggered
If you believe your stop was hit even though the candle did not touch it, use a structured investigation.
- Check whether the position was long or short. This tells you whether bid or ask is normally relevant to the closing price.
- Record the exact stop level. Do not rely on a rounded screenshot.
- Check the broker’s execution history. Look for the exact trigger and fill information available on the platform.
- Check bid/ask data. If the platform provides historical bid/ask information, compare it with the stop level.
- Check the spread at that moment. A temporary spread expansion can explain a difference that is invisible on a mid-price chart.
- Compare the same timestamp using the broker’s own data. A third-party chart is useful for context but is not necessarily the execution record.
- Check for news or abnormal volatility. Rapid price movement can create both wider spreads and slippage.
10. Should You Simply Put Your Stop Further Away?
Not automatically.
Moving a stop farther away just to avoid being stopped can increase the amount of money at risk. The better approach is to design the stop around the trade’s invalidation level and then size the position so that the monetary risk remains acceptable.
For example, if a technical setup becomes invalid below a structural low, placing the stop slightly beyond that structure may make more sense than placing it at an arbitrary number of points simply because the chart has a visible wick.
Then adjust the position size to maintain your chosen account-risk percentage.
Position size should adapt to stop distance — not the other way around.
11. A Practical XAU/USD Stop-Loss Checklist
- Know whether your chart displays bid, ask, mid or another price series.
- Know which price your broker uses for stop triggering.
- Check the current XAU/USD spread before placing a tight stop.
- Allow for normal spread variation during volatile periods.
- Avoid assuming that every wick is a stop hunt.
- Use broker execution data when investigating a disputed stop.
- Keep monetary risk fixed by adjusting position size.
- Remember that a stop price does not necessarily guarantee the final execution price.
Why This Matters for Gold Traders
The biggest lesson is simple: a candlestick is a visual representation of price data, while your stop loss is an execution instruction tied to a specific price stream.
When those two price streams are not identical, a stop can be triggered even though the candle on your screen appears not to have reached the level.
This becomes more important on XAU/USD because gold can move quickly and spreads can change during volatile market conditions. Understanding bid/ask pricing, chart construction, spread and execution can prevent traders from incorrectly blaming every unexpected stop-out on manipulation.
If your strategy relies on very tight XAU/USD stops, test it using the same broker, account type and price feed you intend to trade. A setup that looks perfect on a generic chart may behave differently once real bid/ask execution is included.
Frequently Asked Questions
Can XAU/USD hit my stop loss even if the candle does not touch it?
Yes. If your chart displays a different price series from the bid or ask price used to trigger the stop, the executable price can reach the stop while the visible candle appears not to.
Does spread affect XAU/USD stop losses?
Yes. A changing spread can create a larger difference between the chart price and the price used to close a position. This is particularly important when the stop is very close to the market.
Why did my long XAU/USD trade stop out below what I saw on the chart?
A long position is normally closed using the bid price. If your chart is displaying a mid or ask-related price, the bid may reach the stop before the displayed chart price appears to do so.
Can a short XAU/USD trade have the opposite problem?
Yes. A short position is normally closed using the ask price, so an ask-price spike can trigger a stop even when the chart’s displayed high appears slightly below the stop.
Is every XAU/USD stop-out a stop hunt?
No. A stop-out can result from normal bid/ask mechanics, spread changes, volatility, liquidity conditions or genuine price movement. Broker execution data should be checked before concluding that a stop was manipulated.
Can I prevent this completely?
No. You cannot eliminate market execution risk completely. You can, however, understand your broker’s pricing model, avoid unnecessarily tight stops, account for spread and volatility, and size positions according to the actual stop distance.
Related TradeOG Guides
- What Is Stop Loss in Trading? Beginner’s Guide
- Gold Volatility Explained: Why XAU/USD Can Move So Fast
- Prop Firm Stop Orders and Slippage During Volatile Markets
- Why Does Slippage Increase When Market Volatility Is Extremely High?
- XAU/USD New York Session Behavior Explained
Disclaimer: This article is for educational purposes only. Broker pricing, order-trigger rules, spreads and execution methods can differ by provider, instrument, account type and jurisdiction. Always review your broker’s current product and order documentation before trading.
[…] For a deeper explanation, see Spread Expansion vs Slippage: What’s Actually Happening? and Why XAU/USD Can Hit Your Stop Loss Without Breaking the Candle Low. […]
[…] TradeOG covers a related XAU/USD example in Why XAU/USD Can Hit Your Stop Loss Without Breaking the Candle Low. […]
[…] For related execution behaviour, see Why XAU/USD Can Hit Your Stop Loss Without Breaking the Candle Low. […]