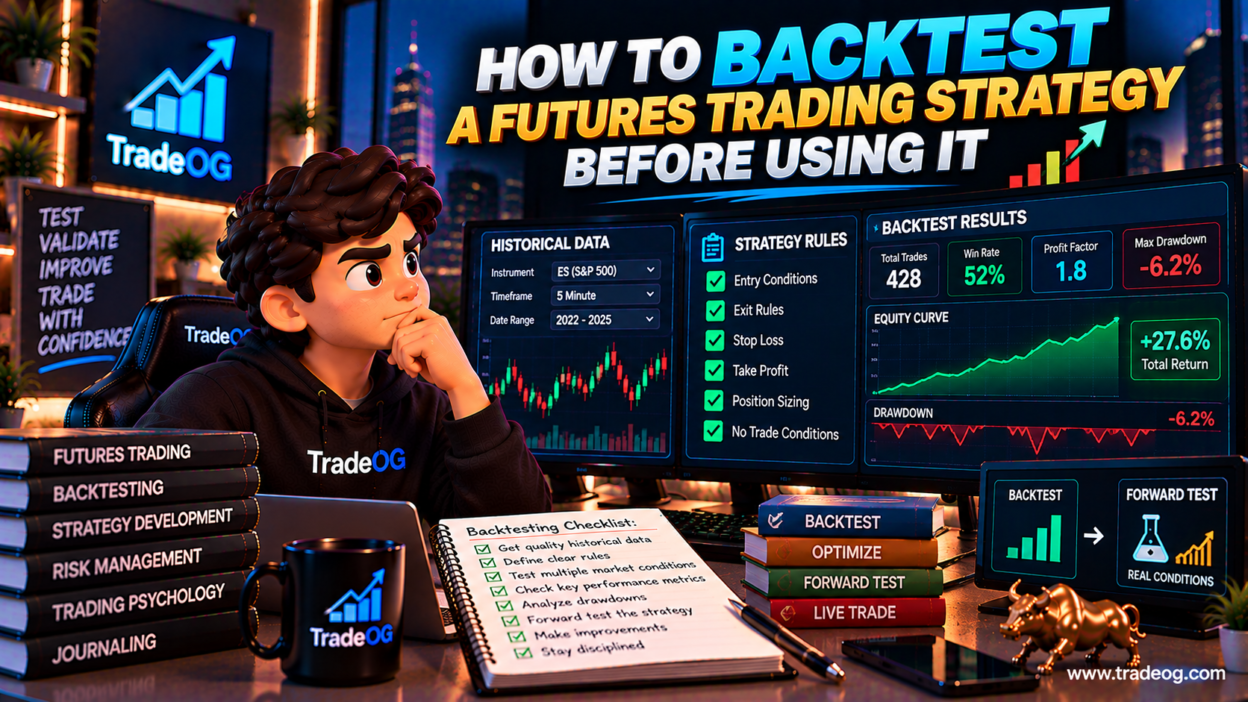
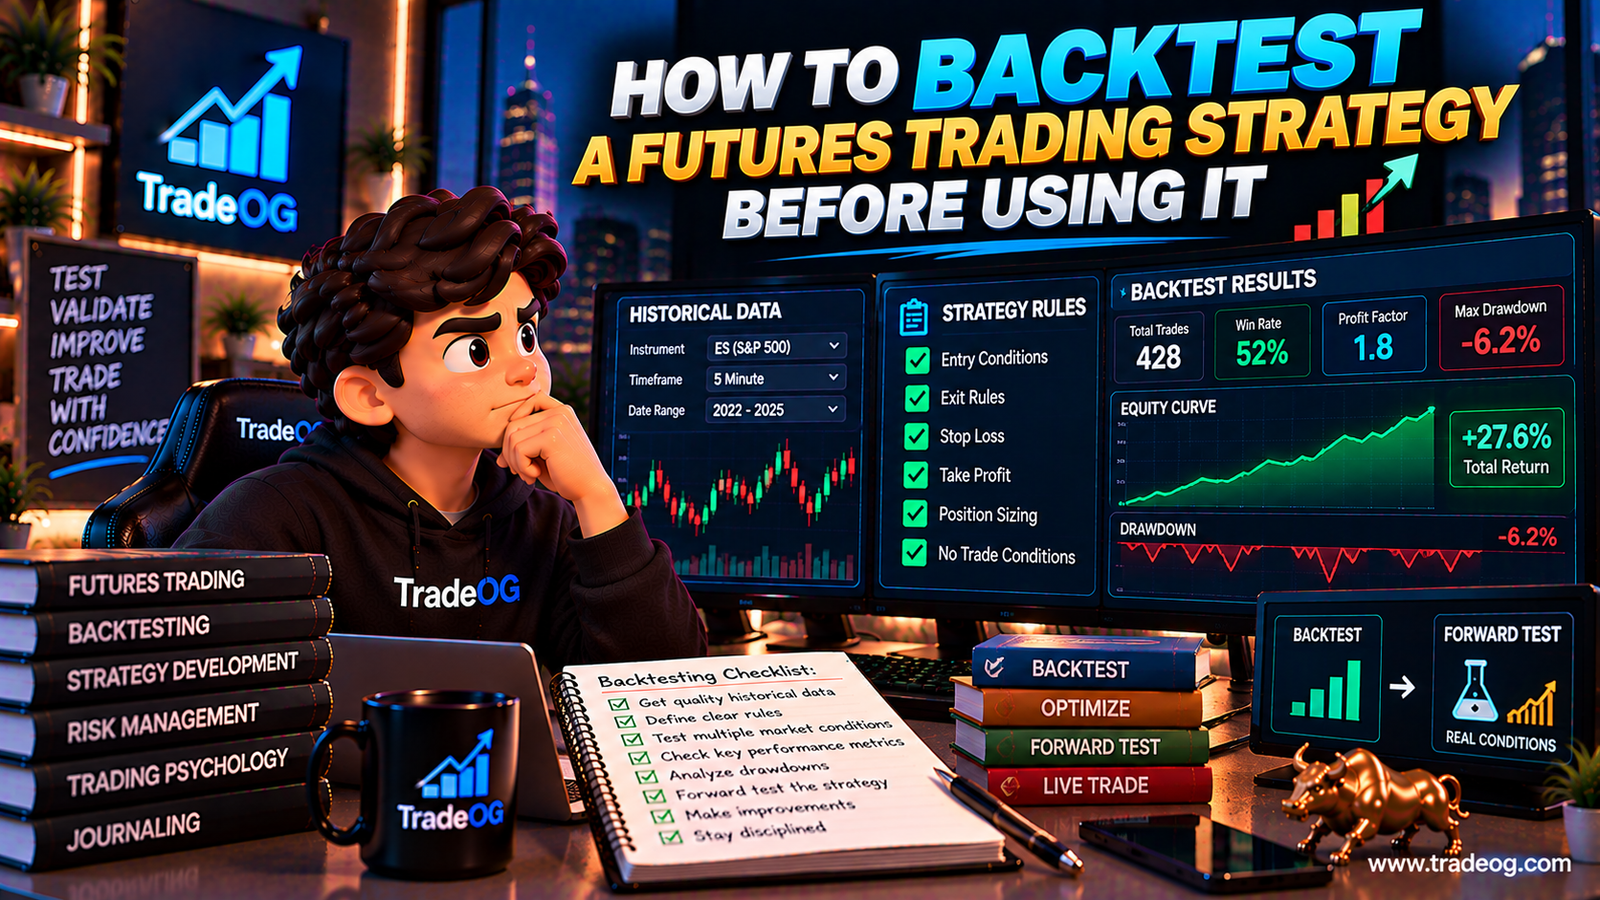
How to backtest a futures trading strategy before using it is one of the most important skills a futures trader can develop before putting meaningful capital at risk.
A strategy can look excellent on a chart and still fail when tested across a larger sample. A few attractive historical trades do not establish an edge, and a profitable backtest does not guarantee future profitability.
Backtesting is better understood as a controlled historical experiment: define the rules first, apply those rules to historical market data, record every qualifying trade, include realistic costs and execution assumptions, and then test the strategy on data that was not used to design it.
CME Group provides historical futures data and continuous price-series resources that can be used for strategy research, while its trading simulator provides real-market futures data for practice and forward testing. CME Group — Continuous Price Series and CME Group — Trading Simulator FAQ.
This guide explains a practical futures backtesting workflow, including strategy rules, contract selection, historical data, entries, exits, position sizing, commissions, slippage, drawdown, losing streaks, out-of-sample testing and the transition from backtest to forward test.
What Is Backtesting?
Backtesting means applying a defined trading strategy to historical data to see how it would have behaved under specified assumptions.
For a futures strategy, the test might specify:
- instrument;
- contract;
- timeframe;
- session;
- entry conditions;
- stop-loss rules;
- profit-taking rules;
- position size;
- maximum trades;
- news restrictions;
- commission and fees;
- slippage assumptions;
- daily loss rules;
- maximum drawdown.
The result is a dataset of simulated trades that can be analyzed statistically.
The purpose is not to prove that the strategy will make money in the future. The purpose is to determine whether the historical evidence is strong enough to justify further testing.
Why Futures Backtesting Is Different
Futures are not simply stocks with leverage.
Contracts expire. Tick values differ. Trading sessions have defined schedules. Liquidity changes throughout the day. Some markets experience significant volatility around economic releases. Contract specifications can also change across products.
CME Group’s position and risk-management guidance highlights three important variables: the futures contract selected, the number of contracts traded and the stop level used to control risk. CME Group — Position and Risk Management.
That means a realistic futures backtest should model more than just whether a candle moved in the expected direction.
Step 1: Write the Strategy Before Looking at Results
The first rule of backtesting is simple:
Define the strategy before optimizing it.
If you scroll through historical charts first, you will naturally notice patterns that worked and may unconsciously modify your rules to capture them.
Write down the strategy before testing.
Example strategy specification
- Market: MES
- Timeframe: 5 minutes
- Trading session: predefined U.S. session
- Setup: opening-range breakout
- Entry: confirmed breakout according to written rules
- Stop: predefined structure-based distance
- Target: predefined R-multiple
- Position size: one contract during initial testing
- Maximum entries: predefined
- News rule: predefined
- Exit: stop, target or session close
The specific strategy above is only an example. Your own strategy may use moving averages, market structure, VWAP, price action, mean reversion or another methodology.
Step 2: Make Every Rule Objective
A backtest becomes unreliable when the rules contain subjective language.
Compare:
Weak rule: “Enter when momentum looks strong.”
Testable rule: “Enter one tick above the high of the qualifying five-minute candle after conditions A, B and C are satisfied.”
The second rule can be repeated consistently.
Every important part of the strategy should answer a specific question:
- What creates the setup?
- What confirms the setup?
- Where is entry?
- Where is the stop?
- Where is the target?
- How many contracts are allowed?
- When is a trade invalid?
- Can another trade be taken after a loss?
- When does the session end?
Step 3: Choose the Correct Futures Contract
Do not backtest a generic “index” without defining the actual futures product.
For example, ES and MES track the S&P 500 futures market but have different contract sizes. NQ and MNQ similarly provide different levels of dollar exposure.
CME’s futures education explains that different contracts can have different volatility and tick-value characteristics, which directly affects dollar risk. CME Group — Position and Risk Management.
Your backtest should therefore record:
- contract symbol;
- tick size;
- tick value;
- point value;
- contract multiplier;
- session schedule;
- roll methodology.
Step 4: Understand Futures Contract Expiration and Rolls
This is one of the biggest differences between futures backtesting and testing a single perpetual market.
Futures contracts expire.
If your historical test spans multiple contract months, you need a defined method for handling the transition.
Possible approaches include:
- testing each individual contract separately;
- using a properly constructed continuous series;
- using an adjusted continuous series where appropriate;
- rolling according to a predefined liquidity or volume rule.
CME’s Continuous Price Series provides continuous futures datasets and distinguishes between Active Contract and Front Contract approaches, while mapping volume and open interest across the historical series. CME Group — Continuous Price Series.
Do not switch contracts manually only when a chart looks convenient.
Step 5: Select Appropriate Historical Data
Your data resolution should match the strategy.
A daily strategy may work with daily data. A five-minute strategy requires substantially more detailed intraday data.
A scalping strategy may require tick-level or high-resolution data to model execution realistically.
CME notes that its futures data is available at resolutions ranging from top-of-book to full depth-of-book for research and execution-related applications. CME Group — Futures and Options Data.
Use the highest practical data quality required by your methodology rather than assuming every backtest can use the same data.
Step 6: Define the Test Period
Do not choose a historical period simply because it produced attractive results.
Try to include different market conditions.
For example:
- strong trends;
- sideways markets;
- high-volatility periods;
- low-volatility periods;
- major news environments;
- quiet sessions;
- different calendar years.
A strategy that only works during one market regime may not be robust enough for live use.
Step 7: Split Your Data Into Development and Validation Periods
One of the most important improvements to a basic backtest is separating the data.
Use one section for strategy development and another section for validation.
For example:
| Period | Purpose |
|---|---|
| Development sample | Write and refine the strategy |
| Validation sample | Test the finalized rules on unseen data |
| Forward test | Observe execution in current conditions |
If you repeatedly modify the strategy after seeing the validation results, that validation period is no longer truly unseen.
Step 8: Avoid Look-Ahead Bias
Look-ahead bias occurs when the backtest uses information that would not have been available at the time of the simulated trade.
Examples include:
- using the final high or low of a candle before that candle has closed;
- using future volume information;
- selecting a parameter because you already know the later result;
- entering at a price that was only visible after the market moved through it;
- using future contract information that was unavailable at the decision point.
A simple rule helps:
At every simulated decision, only use information that would have been known at that exact moment.
Step 9: Define Exactly How Entries Are Filled
Entry price matters enormously in futures.
If the strategy says “buy on breakout,” determine exactly how the order would be executed.
Possible assumptions include:
- market order;
- limit order;
- stop order;
- stop-limit order.
A historical candle crossing a level does not automatically mean that you received the exact level.
For a realistic backtest, define the fill logic before reviewing the final results.
Step 10: Model Stop-Loss Execution Realistically
A stop-loss is a risk-control rule, but it does not necessarily guarantee an exact fill price.
During fast markets, gaps or low-liquidity conditions, the actual execution can differ from the planned stop.
Your backtest should therefore document its stop assumptions.
For example:
- fixed stop price;
- one-tick slippage;
- multiple ticks of slippage during high volatility;
- market-exit assumption after stop trigger.
The appropriate model depends on the instrument, timeframe, order type and data available.
Step 11: Include Commissions and Fees
A strategy that makes $20 per trade before costs may not be attractive after realistic trading expenses.
Include applicable:
- commission;
- exchange fees;
- regulatory fees;
- data costs where relevant;
- other execution expenses.
This is especially important for strategies that generate many trades or target small price movements.
Step 12: Include Slippage
Slippage is the difference between the expected and actual execution price.
It can become particularly important around:
- economic releases;
- market opens;
- market closes;
- fast breakouts;
- thin liquidity;
- large order sizes.
A backtest that assumes every order receives the exact theoretical price can materially overstate performance.
Step 13: Define Position Sizing Before Testing
Do not decide contract size after seeing the strategy’s profit curve.
Start with a predefined risk model.
A basic futures calculation is:
Risk per contract = Stop distance × Dollar value per point
Then:
Contracts = Maximum planned risk ÷ Risk per contract
The result must also comply with the permitted contract size and account rules.
CME’s risk-management guidance specifically recommends determining contract count from risk scenarios rather than simply trading the maximum quantity permitted by margin requirements. CME Group — Position and Risk Management.
Step 14: Test the Strategy With One Contract First
For an initial strategy test, using one contract can make the logic easier to inspect.
Once the trade logic is validated, apply the position-sizing model separately.
This separates two questions:
- Does the strategy have a historical edge?
- How should the strategy be sized?
Combining them too early can make it difficult to determine why the equity curve changed.
Step 15: Record Every Trade
A proper backtest should generate a trade log.
Useful columns include:
| Field | Example |
|---|---|
| Date | Test date |
| Instrument | MES |
| Setup | Breakout |
| Entry | Historical fill |
| Stop | Historical stop |
| Exit | Target/stop/session |
| Contracts | 1 |
| Gross P&L | Calculated |
| Costs | Calculated |
| Net P&L | Calculated |
| R-multiple | +2R / -1R |
| Market regime | Trend/Range |
Without a trade log, you are mostly looking at a curve. With a trade log, you can investigate why the curve behaved the way it did.
Step 16: Calculate the Core Backtest Metrics
Do not stop at total profit.
Win rate
Winning trades ÷ Total trades × 100
Average win
The average result of profitable trades.
Average loss
The average result of losing trades.
Expectancy
(Win rate × Average win) − (Loss rate × Average loss)
Profit factor
Gross profit ÷ Gross loss
Maximum drawdown
The largest peak-to-trough decline in the equity curve.
Maximum consecutive losses
The largest observed losing streak.
Average trade
Total net P&L divided by number of trades.
These metrics describe the strategy much better than a single return percentage.
Step 17: Analyze the Equity Curve
A profitable final result can hide an uncomfortable path.
Look for:
- long periods of stagnation;
- deep drawdowns;
- clusters of losses;
- rapid profit spikes;
- unstable performance;
- large dependence on a small number of trades.
Ask whether you could realistically continue trading the strategy during its worst historical period.
Step 18: Analyze Maximum Drawdown
Suppose a strategy produces a 30% total historical return but experiences a 15% drawdown.
The headline return does not tell you whether the drawdown is acceptable for your account.
For prop traders, translate the historical drawdown into the actual account’s risk model.
For example, if a strategy historically experiences six consecutive full-risk losses, ask whether the planned position size and account drawdown buffer can tolerate that sequence.
Step 19: Study Losing Streaks
Losing streaks are normal in trading systems.
Measure:
- maximum consecutive losses;
- average losing streak;
- largest daily loss;
- largest weekly loss;
- loss clusters by market regime;
- recovery time after drawdown.
This information is particularly important when testing a strategy for a prop firm challenge.
Step 20: Check Daily Loss Exposure
A strategy can have positive long-term expectancy and still be unsuitable for an account if its normal daily loss clusters are too large.
Calculate:
Daily exposure = Sum of risk across trades taken that day
Then compare historical daily losses with the specific account’s rules.
Do not assume that a strategy is safe simply because its overall backtest is profitable.
Step 21: Test the Strategy Against Prop-Firm Constraints
If the strategy is intended for a prop challenge, create a second layer of testing.
Model relevant rules such as:
- maximum loss;
- daily loss limit;
- maximum position size;
- consistency requirements;
- news restrictions;
- session restrictions;
- mandatory liquidation times;
- contract restrictions.
These rules differ by provider and account model.
For example, Topstep’s current Trading Combine parameters include a Maximum Loss Limit, Profit Target, Consistency Target and maximum position size. Topstep — Trading Combine Parameters.
The objective is not to make the backtest “pass” a particular provider by manipulating the strategy. The objective is to determine whether your existing strategy remains viable under the actual account constraints.
Step 22: Simulate the Actual Challenge Rules
Suppose the strategy is being considered for a hypothetical evaluation account.
Build a simulation that includes:
- starting balance;
- profit target;
- maximum loss;
- daily loss mechanism;
- position limits;
- trading session;
- news restrictions;
- payout or consistency rules if applicable.
Then run the historical strategy through those constraints.
Measure:
- percentage of historical simulations that reached the target;
- percentage that breached the loss boundary;
- average time to target;
- maximum drawdown before success;
- number of daily loss violations;
- number of rule violations.
This is much more informative than simply asking whether the strategy was profitable.
Step 23: Avoid Curve Fitting
Curve fitting occurs when a strategy is optimized so heavily around historical data that it performs well mainly because it has adapted to the past.
Examples include repeatedly changing:
- moving-average lengths;
- entry thresholds;
- stop distances;
- profit targets;
- session windows;
- indicator combinations.
If you keep testing variations until one produces the best historical result, the resulting performance can be misleading.
CME research on backtesting specifically discusses data mining, multiple testing, overfitting and out-of-sample testing as important considerations when interpreting historical strategy performance. CME Group — Backtesting Research.
Step 24: Use Out-of-Sample Testing
After finalizing the strategy, test it on a period that was not used to develop the rules.
For example:
Development: 2021–2024
Out-of-sample: 2025–2026
The dates are illustrative.
The important principle is that the second dataset should remain unseen while the rules are being developed.
Step 25: Perform Sensitivity Testing
Do not test only one exact parameter.
Suppose the strategy uses a 20-point stop.
Test a reasonable range around it.
If the strategy works only at exactly 20 points and collapses at 19 or 21, that can be a warning sign that the parameter may be overly optimized.
Robust strategies often tolerate reasonable parameter variation better than highly curve-fitted systems.
Step 26: Test Different Market Conditions
Segment the results.
| Condition | Question |
|---|---|
| Trending | Does the strategy capture directional movement? |
| Range-bound | Does performance deteriorate? |
| High volatility | Do stops and slippage become problematic? |
| Low volatility | Does the strategy produce enough movement? |
| News sessions | Does execution remain realistic? |
| Different times | Is performance concentrated in one window? |
A strategy does not necessarily need to work equally well everywhere. But you should understand where it works and where it struggles.
Step 27: Check Whether a Small Number of Trades Creates Most of the Profit
This is an important robustness test.
Suppose the strategy made $50,000 in the backtest.
If five unusually large trades generated $40,000 of that profit, the headline return may be less stable than it appears.
Analyze:
- profit contribution by trade;
- profit contribution by month;
- profit contribution by setup;
- profit contribution by market regime.
A more evenly distributed result can provide more useful information about the strategy’s behaviour.
Step 28: Randomize the Trade Sequence
The order of historical trades matters for drawdown.
A strategy with the same set of winning and losing trades can produce very different drawdowns depending on sequence.
Simple Monte Carlo or trade-sequence randomization can help estimate:
- possible drawdown ranges;
- possible losing streaks;
- risk of ruin under different assumptions;
- variation in final equity.
Monte Carlo does not make the strategy more profitable. It helps you understand how much uncertainty exists around the historical sequence.
Step 29: Add Realistic Execution Stress Tests
Run the strategy under worse assumptions.
For example:
- higher slippage;
- higher commissions;
- slightly worse entries;
- slightly worse exits;
- fewer fills on limit orders;
- larger spreads where applicable.
If the strategy remains viable under reasonable stress, that can provide more confidence than a single optimistic backtest.
Step 30: Forward-Test After Backtesting
Backtesting should not automatically lead to live trading.
The next stage is forward testing.
Use a simulator or paper environment to test whether the strategy behaves similarly under current market conditions.
CME’s simulator uses real market data and provides performance tracking, while CME also notes that users can use the simulator to backtest and forward-test methodologies against real market data. CME Group — Trading Simulator FAQ.
Step 31: Compare Backtest and Forward-Test Results
After a forward-test sample, compare:
| Metric | Backtest | Forward Test |
|---|---|---|
| Win rate | Historical | Live simulation |
| Average win | Historical | Observed |
| Average loss | Historical | Observed |
| Slippage | Assumption | Observed |
| Trade frequency | Historical | Observed |
| Drawdown | Historical | Observed |
Large differences deserve investigation before increasing risk.
Step 32: Know When the Backtest Is Not Good Enough
Do not force a strategy through the process simply because you spent time building it.
Warning signs include:
- negative expectancy;
- unacceptable drawdown;
- extreme sensitivity to one parameter;
- poor out-of-sample performance;
- large dependence on a few trades;
- unrealistic fill assumptions;
- poor performance after costs;
- strategy failure under modest slippage stress;
- incompatibility with account rules.
Sometimes the best backtest result is discovering that a strategy should not be traded.
How to Backtest a Strategy Manually
You do not necessarily need sophisticated software.
A spreadsheet can work for a simple discretionary strategy.
Create columns for:
- date;
- time;
- instrument;
- setup;
- entry;
- stop;
- target;
- position size;
- result;
- R-multiple;
- notes.
Then move chronologically through the historical chart and record every trade according to the rules.
The key is to avoid skipping losing trades or choosing only attractive setups.
How to Backtest With TradingView
TradingView can be useful for chart-based strategy research and automated or semi-automated testing when the strategy can be expressed in precise rules.
A practical workflow is:
- Define the strategy.
- Choose the futures symbol.
- Define the timeframe.
- Code the rules in Pine Script if appropriate.
- Run the historical test.
- Export or record the trade results.
- Analyze drawdown and expectancy.
- Test different market periods.
- Validate on unseen data.
- Forward-test.
Do not assume that a platform’s default strategy settings perfectly model real-world futures execution. Verify contract specifications, commissions, order behaviour and session settings.
How to Backtest a Discretionary Futures Strategy
Discretionary strategies can still be tested, but the rules need to be made more explicit.
Instead of asking:
“Would I have taken this trade?”
create a checklist:
- Was condition A present?
- Was condition B present?
- Was the entry inside the permitted zone?
- Was the stop valid?
- Was the target valid?
- Was the trade during the permitted session?
- Was a restricted event active?
Then apply the same checklist to every historical opportunity.
How Many Trades Should You Backtest?
There is no universal magic number.
The required sample depends on strategy frequency, market variability, number of parameters and the confidence level you want from the analysis.
A strategy that generates several trades every day can build a dataset faster than a strategy that produces only a few trades per month.
More important than a fixed number is obtaining a sample that is large enough to expose the strategy to multiple market conditions and losing sequences.
What Metrics Should You Require Before Going Live?
There is no universal pass/fail threshold.
Instead, define your own criteria before looking at the final results.
Your checklist might include:
- positive net expectancy;
- acceptable maximum drawdown;
- reasonable profit factor;
- manageable consecutive losses;
- stable performance across multiple periods;
- acceptable results after costs;
- reasonable sensitivity to execution assumptions;
- positive out-of-sample results;
- forward-test consistency.
This prevents you from changing the acceptance criteria after seeing the result.
Backtesting Checklist for Futures Traders
| Check | Completed? |
|---|---|
| Strategy rules written before testing | ☐ |
| Correct futures contract selected | ☐ |
| Historical data verified | ☐ |
| Contract rolls handled correctly | ☐ |
| Entry rules objective | ☐ |
| Exit rules objective | ☐ |
| Position sizing predefined | ☐ |
| Commission included | ☐ |
| Slippage modeled | ☐ |
| Look-ahead bias checked | ☐ |
| Drawdown measured | ☐ |
| Losing streaks measured | ☐ |
| Out-of-sample test completed | ☐ |
| Stress test completed | ☐ |
| Forward test completed | ☐ |
Common Backtesting Mistakes
1. Testing only profitable periods
A strategy needs exposure to difficult market conditions.
2. Changing rules after every losing trade
This can turn testing into curve fitting.
3. Ignoring commissions
Small-edge strategies can be particularly sensitive to costs.
4. Ignoring slippage
Perfect fills can produce unrealistic results.
5. Using future information
Look-ahead bias can make a strategy appear much better than it actually is.
6. Choosing the best contract retroactively
The backtest should use a predefined instrument and roll methodology.
7. Measuring only total return
Drawdown and losing streaks are critical risk metrics.
8. Optimizing too many parameters
More parameters can increase the chance of fitting noise.
9. Ignoring out-of-sample performance
A strategy should face data that was not used during development.
10. Going live immediately after a good backtest
Forward testing is an important bridge between historical simulation and live execution.
Backtesting for Prop Firm Traders: A Better Workflow
If your goal is to use the strategy in a prop firm challenge, use this sequence:
- Build the strategy. Write exact rules.
- Backtest it. Use historical futures data.
- Add costs. Include commissions and realistic slippage.
- Measure risk. Analyze drawdown and losing streaks.
- Validate it. Use unseen historical data.
- Stress test it. Make execution assumptions worse.
- Apply account rules. Model the exact challenge constraints.
- Forward-test it. Use current market data.
- Journal it. Compare actual execution with the backtest.
- Scale only after evidence. Keep position sizing consistent with the risk plan.
Final Takeaway
Backtesting a futures trading strategy is not about finding a beautiful historical equity curve. It is about discovering whether a clearly defined process has enough historical evidence, realistic risk characteristics and robustness to justify further testing.
The strongest workflow is:
Rules → Historical Data → Trade Simulation → Costs → Risk Analysis → Out-of-Sample Testing → Stress Testing → Forward Testing.
Start by writing the rules before looking at the results. Use appropriate futures data and handle contract expiration and rolls correctly. Model entries, exits, commissions and slippage instead of assuming perfect fills. Measure expectancy, profit factor, drawdown and losing streaks rather than focusing only on total return.
Then test the strategy on unseen data.
Finally, forward-test it in current market conditions before increasing exposure.
CME’s current resources provide both historical futures datasets and a simulator using real market data, making it possible to separate historical research from forward practice. CME Group — Continuous Price Series and CME Group — Trading Simulator FAQ.
For prop traders, the final question is not simply “Did the backtest make money?” It is:
“Would this strategy’s historical behaviour, under realistic execution and the actual account rules, have been manageable enough to trade consistently?”
If the answer is unclear, keep testing rather than rushing into a funded evaluation.
FAQs
What is the easiest way to backtest a futures strategy?
For a simple discretionary strategy, a spreadsheet and historical chart can be enough. For rules that can be coded precisely, a strategy-testing platform can automate trade generation and statistics.
How much historical data should I use?
Use enough data to expose the strategy to multiple market regimes and meaningful losing sequences. There is no universal number of months or trades that guarantees a valid test.
Should I include commissions in a futures backtest?
Yes. Net performance is more informative than gross performance, especially for strategies with frequent trades or small profit targets.
Should I include slippage?
Yes. Use reasonable assumptions based on the instrument, timeframe, order type and market conditions. Consider running multiple slippage scenarios.
What is look-ahead bias?
Look-ahead bias occurs when a backtest uses information that would not have been available at the time of the simulated decision. It can materially inflate historical performance.
Can a profitable backtest guarantee future profits?
No. Historical performance is not a guarantee of future results. Market regimes, liquidity, execution and strategy behaviour can change.
Should I backtest ES, MES, NQ and MNQ separately?
If you intend to trade different contracts, testing them separately is usually useful because volatility, tick values, liquidity and contract characteristics differ. Do not assume that a strategy’s performance transfers perfectly between instruments.
Should I backtest a strategy before using it in a prop firm challenge?
Yes, historical testing and forward testing can help you understand the strategy’s expected behaviour before risking an evaluation fee or funded account. You should also model the exact rules of the account you intend to use.
What is more important: win rate or drawdown?
Neither metric should be considered alone. Win rate describes trade frequency of wins, while drawdown describes the depth of equity declines. Expectancy, average win/loss, drawdown and losing streaks should be analyzed together.
When should I stop testing and start forward testing?
Once the rules are fixed, the historical sample is sufficiently broad, costs and execution assumptions are realistic, and the strategy has passed an out-of-sample check, forward testing is the logical next stage. Do not keep optimizing indefinitely simply to improve historical numbers.
TradeOG risk note: This article is educational and does not guarantee that any trading strategy will be profitable. Futures trading involves substantial risk. Historical backtests depend on data quality, assumptions, contract-roll methodology, order execution and costs. Prop-firm rules, contract limits, drawdown calculations and trading restrictions can change, so verify current official rules for your specific account before trading.