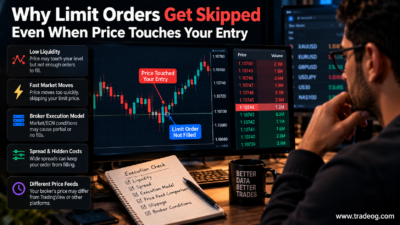

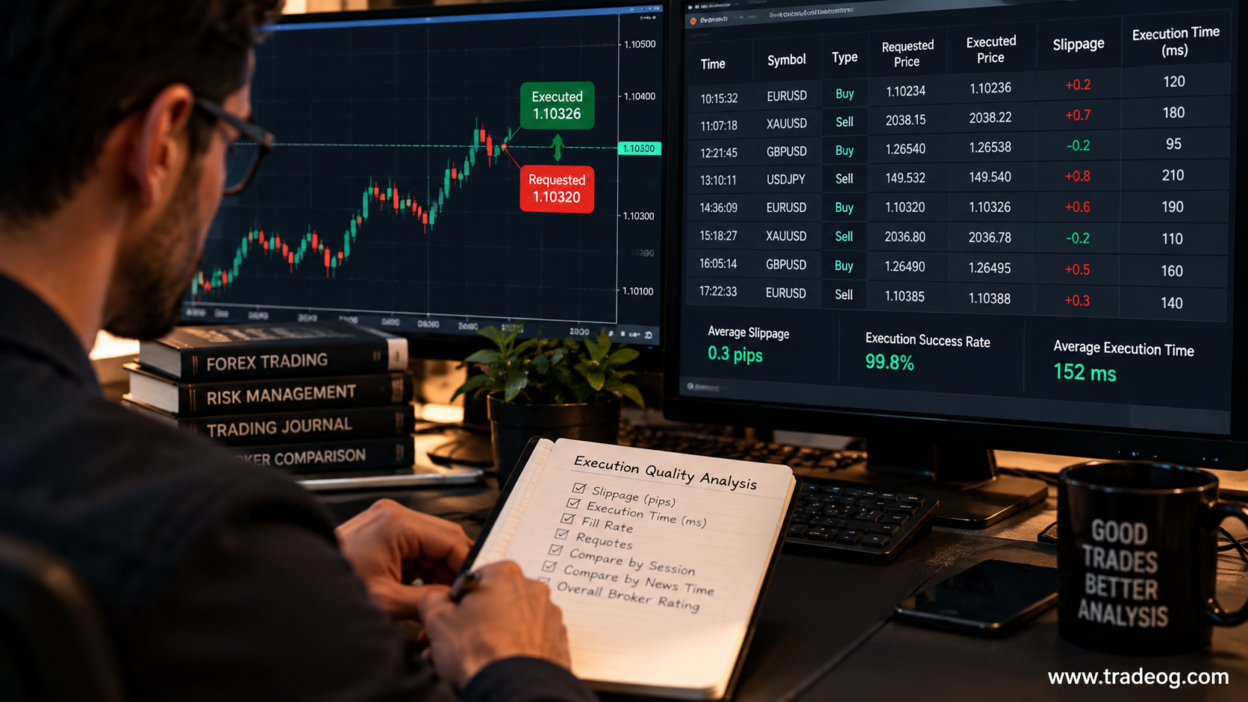
A broker can advertise tight spreads and fast execution, but those claims do not tell you what happens when you actually click Buy or Sell. Your own order history is a better starting point. It shows the prices you received, the costs you paid and whether fills changed in particular market conditions.
You do not need specialist software to begin. A trade-history export from MT4, MT5 or another platform, plus a spreadsheet, is enough to build a useful picture. The important part is to compare like with like: the same instrument, similar trade sizes and similar market sessions.
What execution quality actually means
Execution quality is the result you get between submitting an order and having it filled. It is not just a speed figure. A platform may respond quickly but give you a worse price, while another order may take a little longer and still receive a better fill.
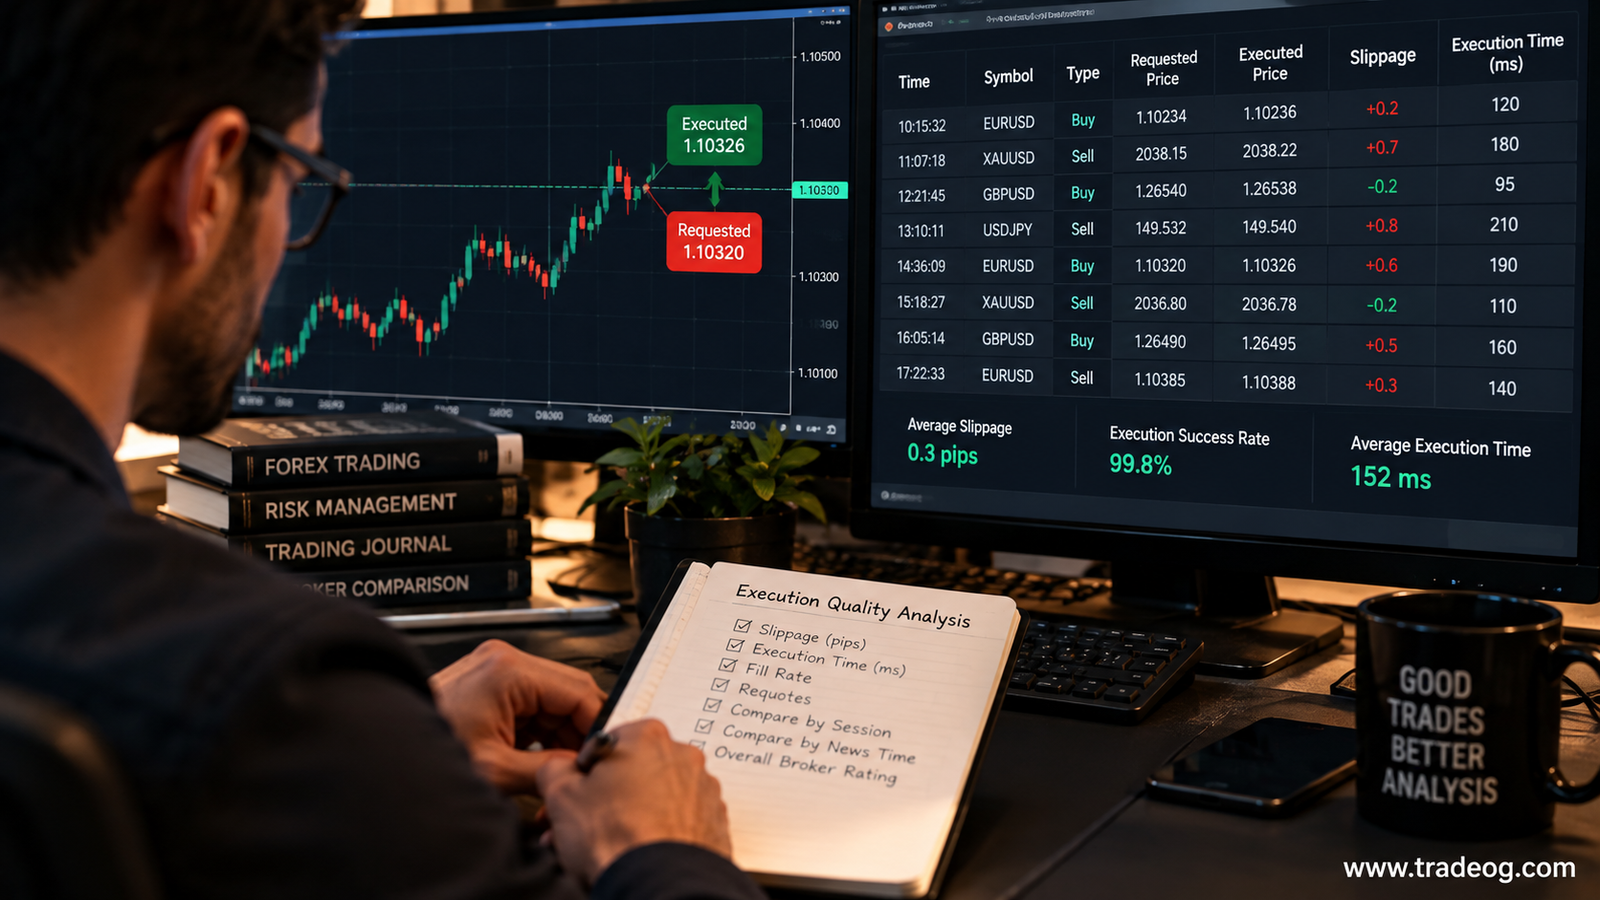
For a practical review, focus on these measures:
- Spread at entry: the difference between the Bid and Ask available when you traded.
- Slippage: the difference between the price you expected or requested and the price actually filled.
- Fill rate: how often orders are filled as intended, including partial fills where relevant.
- Requotes and rejections: how often orders are requoted, rejected or fail to execute.
- Execution time: the time from order submission to confirmation, if your platform records both timestamps.
- Total trading cost: spread, commission, slippage and any relevant financing or conversion charges.
One metric cannot tell the whole story. A low average slippage figure may hide a handful of very costly fills, and a fast average execution time says little about the price you received.
1. Export your trade history and keep the useful fields
Download your account history for a meaningful sample. A few trades can be misleading, so aim for several weeks or a few hundred orders if your trading frequency allows it. Do not wait for a magic sample size; record what you have and treat early results as provisional.
Keep as many of these fields as your platform provides:
- Order or deal ID
- Instrument, direction and order type
- Order submission time and fill time, including the time zone
- Requested price or quote at submission
- Actual fill price
- Position size, spread and commission
- Execution status, partial-fill details and rejection or requote messages
- Market session and whether a major news release was near the trade
Some platforms do not show the original requested price or order-submission timestamp in the standard history export. Do not invent these values or use the candle close as a substitute. If a field is missing, mark it as unavailable and measure only what the records can support. A platform log, broker statement or support response may provide extra details.
2. Calculate slippage in pips
Slippage is the difference between the price you intended to receive and the price of the fill. For a simple comparison, define the sign consistently so a positive number means a worse result for you.
For a market order, one practical convention is:
Buy slippage (pips) = (fill price − reference price) ÷ pip size
Sell slippage (pips) = (reference price − fill price) ÷ pip size
Here, the reference price should be the executable quote you recorded when submitting the order, not a chart price chosen after the fact. For most non-JPY major pairs, a pip is 0.0001; for many JPY pairs, it is 0.01. Check the instrument specification for metals, indices and other CFDs because their tick and pip conventions can differ.
Example: you submit a EUR/USD buy when the recorded executable Ask is 1.08420, but the order fills at 1.08428. The difference is 0.00008, or 0.8 pip using a 0.0001 pip size. That is 0.8 pip of negative slippage for the buy.
If the fill had been 1.08416, the same convention would show −0.4 pip: price improvement rather than slippage against you. Keep favourable and unfavourable outcomes in the data. Counting only bad fills distorts the result.
3. Measure average slippage without hiding the bad fills
Calculate the mean slippage, but do not stop there. Also record the median, the percentage of orders with negative slippage, the percentage with price improvement and the worst few outcomes.
Imagine a sample of 100 orders has average signed slippage of 0.15 pip against the trader. That number is useful, but it does not show whether most orders were close to the reference price or whether a few large misses drove the average. The median and a simple distribution—such as fills within 0–0.2 pip, 0.2–0.5 pip and above 0.5 pip—help explain what is happening.
Keep the same sign convention for every order. Do not average absolute slippage for one broker and signed slippage for another. If you report absolute slippage as a measure of price deviation, label it clearly because it treats favourable and unfavourable fills equally.
4. Compare execution by session and market condition
An overall average can hide the conditions that matter most to your strategy. Split the history into groups that reflect how you trade:
- Quiet versus volatile periods: compare ordinary conditions with major data releases or sudden market moves.
- Trading sessions: London, New York, the overlap and quieter hours may behave differently.
- Instrument: analyse EUR/USD separately from GBP/JPY, gold or an index CFD.
- Order type: market orders, stop orders and limit orders have different fill mechanics.
- Trade size: compare similar sizes before concluding that one group receives worse fills.
For example, if slippage is consistently higher around U.S. inflation data, that does not by itself prove the broker is treating you unfairly. Prices can move sharply, spreads can widen and available liquidity can change. The useful question is whether the pattern is repeatable, how much it costs your strategy and how it compares with a reasonable reference under similar conditions.
5. Check spreads and total cost—not just the entry price
A broker with a small advertised spread may charge commission, while a commission-free account may build more of its cost into the spread. For a fair comparison, calculate the cost per trade in a common unit, such as pips or account-currency money, and include both sides of the trade where applicable.
A simple framework is:
Estimated round-trip trading cost = entry and exit spread cost + commissions + adverse slippage + applicable fees
Use actual account statements for commissions and charges. Be careful not to count the same spread or slippage twice if the platform’s reported profit-and-loss figure already includes it. Overnight financing and currency-conversion costs may matter for longer holds, but they are different from order execution and should be shown separately as well as included in the broader cost comparison.
6. Track fill rate, rejections and execution time
Slippage only covers orders that were filled and can be measured. Also count orders that were rejected, requoted or only partly filled. Define the denominator clearly—for example, filled market orders divided by all valid order attempts—so you are not comparing a broker’s fill rate with another broker’s completion rate calculated differently.
If you have reliable submission and confirmation timestamps, calculate execution time for each order and review the median and the slower end of the distribution. Keep the clock source and time zone consistent. A platform’s displayed “ping” is not the same thing as end-to-end order execution time; it may measure only network round-trip latency to a server.
Do not assume that a slower fill is automatically worse. A limit order can remain unfilled by design, while a market order is intended to execute promptly at available prices. Judge each order against the order type and the rules the broker disclosed.
7. Use a simple comparison table
Build a spreadsheet with one row per order and a summary for each instrument and market condition. A useful summary might look like this:
| Measure | What to record | Why it matters |
|---|---|---|
| Average signed slippage | Pips, with positive defined as worse | Shows the average direction and size of price deviation |
| Median slippage | Pips | Shows a typical fill without being dominated by outliers |
| Negative-slippage rate | Percentage of measured fills | Shows how often fills were worse than the reference |
| Price-improvement rate | Percentage of measured fills | Stops favourable fills from being ignored |
| Rejection / requote rate | Percentage of valid order attempts | Highlights execution interruptions |
| Median execution time | Milliseconds, if reliably available | Helps compare speed under similar conditions |
| All-in trading cost | Pips or account currency | Connects execution quality to actual trading expense |
When comparing two brokers, use the same instrument, similar position sizes, the same order type and comparable sessions. If possible, collect observations over the same dates. Different feeds can show slightly different prices, so record the source and timestamp of any external reference quote.
8. Know what your data cannot prove
Your trade history can reveal patterns; on its own, it usually cannot prove why those patterns occurred. A worse fill could relate to volatility, available liquidity, your internet connection, the order type, the broker’s routing or the reference quote you used. A difference between two brokers is not automatically evidence of manipulation.
For a stronger check, save platform logs and screenshots for unusual fills, note the exact order ID and time, and request an execution report from the broker. Ask for the relevant quote, fill timestamp, order handling explanation and any available audit trail. Compare the response with your records before drawing a conclusion.
Protect your account details when sharing exports. Remove account numbers, names, emails and other personal information before sending a trade log to a third party.
How often should you review execution quality?
Review it monthly, and separately after a platform change, a change in account type or a run of unusual fills. Keep the calculation method unchanged so month-to-month figures remain comparable. If your strategy relies on small targets or frequent entries, even a modest cost difference can matter; for longer-term trades, financing and other costs may carry more weight.
The goal is not to find a broker that never slips. In fast markets, that is an unrealistic standard. The goal is to understand your real trading costs, identify repeatable problems and ask informed questions using evidence from your own orders.
Frequently asked questions
How many trades do I need to assess a forex broker?
Start with the history you have, but treat a small sample as an early indication rather than a verdict. A few hundred comparable orders across different sessions can be more informative than thousands of mixed orders from unrelated instruments and order types.
Can I measure execution quality using MT4 or MT5?
You can calculate several measures from account history and deal exports, including fill prices, commissions and realised costs. Requested-price and timing data may require platform logs or additional broker records, depending on the setup.
Is negative slippage always the broker’s fault?
No. Slippage can occur when prices move between order submission and execution, especially during volatile or thin markets. A repeated pattern deserves investigation, but trade history alone may not identify the cause.
What is more important: execution speed or slippage?
Neither should be judged alone. Speed measures how quickly an order is processed; slippage measures the difference between the reference and fill prices. For many traders, the total cost and reliability of execution are more useful than a single speed figure.
Risk note: Forex and CFD trading involves substantial risk. This guide explains how to review historical execution data; it does not recommend a broker or guarantee future execution conditions.