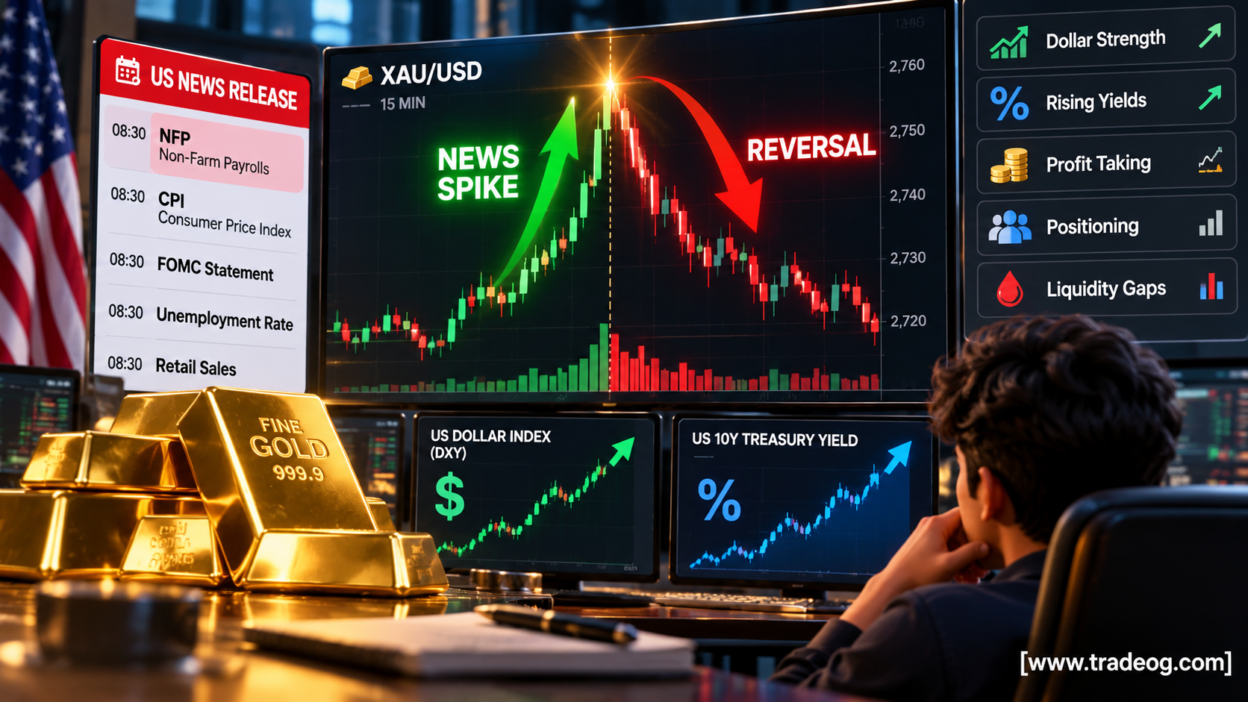
Quick answer: A sharp move in gold after CPI, NFP, FOMC, PCE, jobs data or an unexpected geopolitical headline does not automatically mean a new trend has started. News can create a burst of volatility that looks like a breakout, only for XAU/USD to return to its previous range minutes later. A genuine trend usually shows something more: sustained price acceptance beyond a key level, follow-through after the initial reaction, supportive movement in the US dollar and Treasury yields, and a market structure that remains intact after the first burst of volatility.
This distinction matters because gold can move hundreds of points very quickly when liquidity changes around major news. The first candle often contains several different things at once: repricing, stop orders, profit-taking, spread changes, algorithmic execution and genuine new demand. Treating all of that as a trend is one of the easiest ways for a trader to enter too early.
News Volatility vs a Genuine Gold Trend
News volatility is primarily a reaction to new information. A genuine trend is a persistent change in the balance between buyers and sellers.
That difference sounds simple, but it is difficult to see on a one-minute or five-minute chart because both conditions can begin with a large candle. The chart does not tell you immediately whether the move will last. You have to watch what price does after the initial reaction.
| News volatility | Genuine trend |
|---|---|
| Fast initial spike | Repeated directional movement |
| Large wick or unstable candles | Cleaner continuation |
| Frequent reversals | Higher highs/higher lows or lower lows/lower highs |
| May return to the pre-news range | Holds above or below important levels |
| Often driven by one immediate catalyst | Usually supported by a broader repricing |
| Can fade within minutes | Can persist across sessions |
The goal is not to predict the market perfectly. The goal is to avoid confusing the first reaction with the final direction.
Why Gold Becomes So Volatile Around News
Gold is sensitive to changes in interest-rate expectations, Treasury yields, the US dollar, inflation expectations, risk sentiment and geopolitical demand. When important information arrives, several markets can reprice simultaneously.
For example, a US economic release can change expectations for Federal Reserve policy. That can move Treasury yields and the dollar almost immediately, while gold reacts to both. The resulting XAU/USD candle may therefore represent a chain reaction rather than a simple increase in buying or selling pressure.
The World Gold Council has noted that gold volatility rose sharply in 2026, with large swings influenced by changes in Fed expectations, bond yields, the dollar, position unwinding and stop-loss activity. Its research also notes that volatility spikes have historically tended to mean-revert. World Gold Council research on gold volatility is useful background for understanding why an unusually large candle does not automatically equal a new long-term trend.
1. Start With the News Calendar, Not the Candle
The first question should be: What caused the move?
If gold suddenly jumps at the exact time of CPI, NFP, PCE, an FOMC decision, a Fed speech, a Treasury announcement or another high-impact event, treat the first move as a news reaction until the market proves otherwise.
This is especially important for scalpers. A five-minute candle that normally represents 20 or 30 minutes of price movement may suddenly cover the same distance in seconds. The candle looks powerful, but its size is partly a measurement of temporary volatility.
Use an economic calendar to identify scheduled events before interpreting the chart. Knowing that a large candle occurred during a high-impact release changes the way you should read it.
2. Watch What Happens After the First Spike
This is arguably the most useful test.
Suppose XAU/USD breaks above resistance immediately after a strong US data release. Do not automatically call it a bullish breakout. Watch the next sequence of candles.
A possible news-driven spike may behave like this:
- Price breaks resistance.
- A very large candle appears.
- The next candle cannot extend the move.
- Price falls back toward the breakout level.
- The previous range is reclaimed.
A genuine bullish continuation may look different:
- Price breaks resistance.
- The initial move attracts additional buying.
- Pullbacks remain above the broken level.
- Price forms a higher low.
- Another push creates a higher high.
- The market continues to hold the new area.
The difference is acceptance. A genuine trend does not need to move in a straight line, but it normally shows that traders are willing to transact at prices beyond the old range.
3. Check Whether the Breakout Level Holds
One of the easiest ways to separate a news spike from a developing trend is to mark the level that price broke.
It could be:
- Previous day high or low
- Asian session high or low
- London session high or low
- Major intraday support or resistance
- A clearly established consolidation boundary
- A higher-timeframe swing high or swing low
If gold breaks a level and quickly returns inside the previous range, the breakout deserves suspicion. If price breaks the level, retests it and continues to hold outside the range, the probability of genuine continuation becomes more interesting.
This is closely related to the concept of a false breakout. The important point is that you do not have to predict the breakout before it happens. You can wait for the market to show whether it can hold the new territory.
4. Look for Market Structure, Not Just Candle Size
A huge green candle can be impressive, but candle size alone tells you very little about the quality of the trend.
For a bullish move, traders can watch for a sequence of:
Higher high → pullback → higher low → higher high.
For a bearish move:
Lower low → rebound → lower high → lower low.
If the chart instead shows a huge spike followed by overlapping candles, deep retracements and repeated breaks in both directions, you are probably looking at unstable volatility rather than a clean directional trend.
This is one reason higher-timeframe context matters. A one-minute chart can look strongly bullish while the 15-minute or hourly chart is still inside a major range.
5. Use the US Dollar as Confirmation, Not a Standalone Signal
Because XAU/USD is priced in US dollars, traders naturally watch the Dollar Index when gold moves. But the simple rule of “dollar up, gold down” is not reliable enough to use by itself.
Gold can rise while the dollar rises when other forces dominate, such as safe-haven demand, positioning or concerns about inflation and fiscal conditions.
For that reason, use DXY as contextual confirmation. If gold breaks higher while the dollar weakens and the broader macro story supports lower real rates, the move may have more support than a gold spike occurring while the dollar and yields simultaneously surge.
TradeOG’s guide on how US dollar strength affects gold prices for Indian traders covers this relationship in more detail.
6. Watch Treasury Yields — Especially Real Yields
Treasury yields are another important confirmation tool, but the relationship is more nuanced than simply watching whether the 10-year yield is rising or falling.
Gold does not pay interest. Therefore, changes in real yields can alter the opportunity cost of holding a non-yielding asset. A sharp rise in real yields can create a headwind, while falling real yields can remove that pressure.
But even here, context matters. The World Gold Council has highlighted periods in 2026 when gold remained resilient despite higher yields because other structural forces were supporting demand. In other words, a single cross-market relationship should not override price structure.
Read Gold and US Treasury Yields: Understanding the Relationship and What Is Real Yield and Why Does It Matter for Gold Traders? before treating yields as a standalone gold signal.
7. Ask Whether the Market Is Repricing or Just Liquidating Positions
A news candle can become large because existing positions are being forced out.
Imagine gold has been trending higher for several sessions and traders are heavily long. A hawkish surprise can trigger an initial decline. Stops below nearby lows are then hit, leveraged positions are reduced, and the move accelerates.
The size of the decline can therefore exaggerate the actual fundamental change.
The same thing can happen on the upside. A short-heavy market can experience a rapid squeeze after bullish news. The resulting candle may look like fresh institutional demand even though a meaningful portion of the move is short covering.
This is why a large candle should be treated as evidence of activity, not automatic evidence of a new trend.
8. Measure Follow-Through Instead of Chasing the First Candle
One practical technique is to divide a news move into three stages.
Stage 1: Initial reaction
This is the first burst immediately after the release. Spreads can change, liquidity can become unstable and orders can execute rapidly.
Stage 2: Stabilisation
Price begins to slow down. The market tests whether the new price area can hold. This is where traders can learn more about whether the initial move was accepted.
Stage 3: Confirmation or rejection
Price either establishes structure beyond the original range or returns through the breakout area. The third stage is often more informative than the first candle.
This approach can feel slower, but it reduces the temptation to buy the highest candle or sell the lowest candle simply because the screen suddenly looks exciting.
9. Compare the News Move With the Higher-Timeframe Structure
Imagine gold is trading inside a four-hour range. A CPI release pushes XAU/USD 150 points above the range, but the move immediately stalls.
On a one-minute chart, the market looks like a powerful bullish breakout.
On the four-hour chart, it may simply be a temporary excursion beyond resistance.
Now imagine price breaks the same four-hour resistance, closes beyond it, retests the area and continues higher during the following sessions. That is much stronger evidence that the market has transitioned into a new directional phase.
The lesson is simple: the lower the timeframe, the easier it is to confuse volatility with trend.
10. Session Timing Can Change the Quality of the Move
The same news release can produce different price behaviour depending on when it occurs.
Gold generally becomes more active when major European and US market participants are involved. The London-New York overlap can provide deeper liquidity and more participation, while major US data can introduce a sudden volatility shock.
For Indian traders, this matters because a move that begins during the active US window can continue into the Indian evening or reverse once the initial liquidity shock fades.
See the TradeOG guides on XAU/USD liquidity during the London-New York overlap, London session behaviour and New York session behaviour for more session-specific context.
11. Volatility Can Increase Without Creating Direction
This is one of the most important concepts for gold traders.
Volatility measures how much price is moving. Trend describes the direction and persistence of that movement.
Gold can have extremely high volatility while remaining directionless.
For example:
| Scenario | Volatility | Trend quality |
|---|---|---|
| Large spike, immediate reversal | Very high | Low |
| Large candles both directions | Very high | Low |
| Breakout followed by stable higher lows | High | Improving |
| Moderate candles with persistent structure | Moderate | High |
| Quiet consolidation | Low | None or neutral |
That distinction is especially useful for traders who use ATR or other volatility measures. A rising ATR tells you that the market is moving more. It does not tell you whether the new trend is bullish or bearish.
For a broader explanation, see Gold Volatility Explained: Why XAU/USD Can Move So Fast.
12. Use a Simple Confirmation Checklist
Before treating a major news move as a genuine gold trend, ask these questions:
- Was there a high-impact economic release or headline?
- Did price break a meaningful support or resistance level?
- Did the breakout hold after the first spike?
- Did price form a higher low or lower high in the new direction?
- Is the higher timeframe supporting the same direction?
- Are DXY and Treasury yields behaving consistently with the move?
- Did price continue after the initial news candle?
- Did the market reclaim the pre-news range?
- Are spreads and execution conditions normalising?
- Is there enough room before the next major resistance or support zone?
You do not need every answer to be perfect. But the more independent evidence that agrees, the stronger the case becomes that you are looking at a trend rather than a temporary volatility event.
A Practical Example: CPI Sends Gold Higher
Suppose US inflation data comes in below expectations. Gold immediately jumps through the day’s high.
A beginner may buy immediately because the headline appears bullish for gold.
A more disciplined trader watches the sequence.
First, the dollar weakens and Treasury yields fall. That supports the initial gold reaction.
Next, XAU/USD pauses above the previous high instead of immediately falling back into the range.
Then price pulls back, holds the breakout level and forms a higher low.
Finally, gold breaks the post-news high again.
That sequence provides more evidence of a genuine directional move than the original news candle alone.
Now change the outcome. Gold spikes higher, immediately loses the breakout level, drops through the pre-news range and starts trading on both sides of the original level. The news was important, but the first bullish move did not create sustained acceptance.
In that case, the trader’s job is not to invent a bullish story. The market has already provided evidence that the initial move failed.
Why Chasing News Candles Is Usually a Bad Idea
Chasing the first candle creates three common problems.
1. The entry is late
The trader enters after much of the initial move has already happened.
2. The stop becomes difficult to place
A stop placed close to the entry can be vulnerable to normal post-news noise, while a stop beyond the entire candle may create an unnecessarily large risk.
3. The reward-to-risk ratio can deteriorate
After a large spike, the nearest logical resistance or support may be much closer than it was before the release.
This is particularly important for scalpers. A setup can be directionally correct and still be a poor trade because the entry is too late and the remaining reward is too small.
How Prop Firm Traders Should Handle News-Driven Gold Moves
Prop firm traders need an additional layer of caution because the question is not only whether the direction is correct. It is also whether the execution and the firm’s rules allow the trade.
News can produce spread expansion, slippage and rapid price changes. Some firms also impose restrictions around specific economic releases or prohibit certain forms of news trading.
Before trading a major release, check the firm’s current rules rather than relying on an old screenshot or a trader’s social-media post. TradeOG’s guide on prop firm slippage during high-impact news explains why a correct directional call can still produce a poor execution result.
News Volatility vs Genuine Trend: The Fast Decision Framework
If you want a simple process for live trading, use this sequence:
- Identify the catalyst. Know whether the move followed scheduled data, central-bank communication or an unexpected headline.
- Mark the pre-news range. Record the relevant high, low and nearby support/resistance.
- Do not label the first candle a trend. Call it an initial reaction.
- Wait for stabilisation. Watch whether price holds beyond the broken level.
- Check structure. Look for higher lows in an upside move or lower highs in a downside move.
- Cross-check the macro picture. Look at DXY, Treasury yields and rate expectations.
- Check the higher timeframe. Make sure the move is not simply running into major resistance or support.
- Only then decide whether the market is trending.
This framework does not predict every gold move. It does something more useful: it prevents a trader from assigning certainty to information that the market has not confirmed yet.
Common Mistakes Gold Traders Make After Major News
- Assuming a large candle equals strong trend strength. Candle size can be caused by temporary liquidity conditions.
- Ignoring the event calendar. A scheduled news release changes the meaning of sudden volatility.
- Using DXY alone. Gold is influenced by several macro and market forces.
- Ignoring Treasury yields. Rate expectations can be an important part of the gold reaction.
- Entering before the breakout is confirmed. The market may quickly return to the old range.
- Using a one-minute chart without higher-timeframe context. Short-term noise can look like a major trend.
- Confusing a short squeeze with fresh demand. Position liquidation can exaggerate a move.
- Forgetting execution conditions. Spread and slippage can change significantly around major releases.
Final Takeaway
The most important skill is not predicting whether gold will move after the news. Everyone knows major releases can move XAU/USD. The harder and more valuable skill is deciding whether the move has staying power.
A genuine trend normally proves itself through follow-through, market structure, level acceptance and broader confirmation. News volatility often does the opposite: it produces a dramatic first move, creates a large candle, and then gives much of the move back.
For gold traders, the safest mental model is therefore:
News creates the first reaction. Price action reveals whether that reaction becomes a trend.
Waiting for that distinction can mean missing the first few points of a move. That is usually a much better problem to have than entering a temporary spike and discovering that the “trend” was only a news reaction.
FAQs
How can I tell if a gold move is caused by news?
Check whether the move began immediately after a scheduled economic release, central-bank announcement or major unexpected headline. If timing matches, treat the first move as news volatility until price confirms continuation.
How long should I wait after major news before trading gold?
There is no universal number of minutes. Instead, wait for the market to stabilise and show whether the breakout level holds. The correct waiting period depends on the event, volatility and timeframe.
Does high volatility mean gold is trending?
No. Volatility measures the magnitude of price movement, not its direction or persistence. Gold can be extremely volatile while moving sideways through a wide range.
Should I use DXY and Treasury yields to confirm a gold trend?
They can provide useful context, especially around US macroeconomic events, but neither should be treated as a standalone buy or sell signal. Price structure remains important.
Is a news breakout always a false breakout?
No. News can start genuine trends. The key is whether price accepts the new area and continues building directional structure after the initial reaction.
Why does gold sometimes reverse immediately after breaking a major level?
Stops, profit-taking, position liquidation, changing rate expectations and temporary liquidity conditions can all contribute. A breakout needs follow-through to become a reliable directional signal.
Can Indian traders use the same approach for XAU/USD?
Yes. Indian traders can use the same price-structure and macro framework, while also considering the timing of US releases in IST, broker spreads, execution conditions and any applicable trading or prop-firm restrictions.